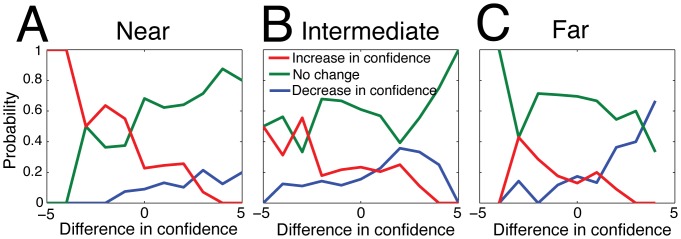
Figure 4. The probability of increasing (red), decreasing (blue), or maintaining (green) the confidence level after social influence.

Changes in confidence are indicated according to the opinion distance classes as defined in the influence map (Fig. 3): (A) near when  , (B) intermediate when
  , and (C) far when
  . A tendency to increase confidence is visible in the near and intermediate zones when participants interact with a more confident subject. Confidence can also decrease in the far zone, when
  .
.
