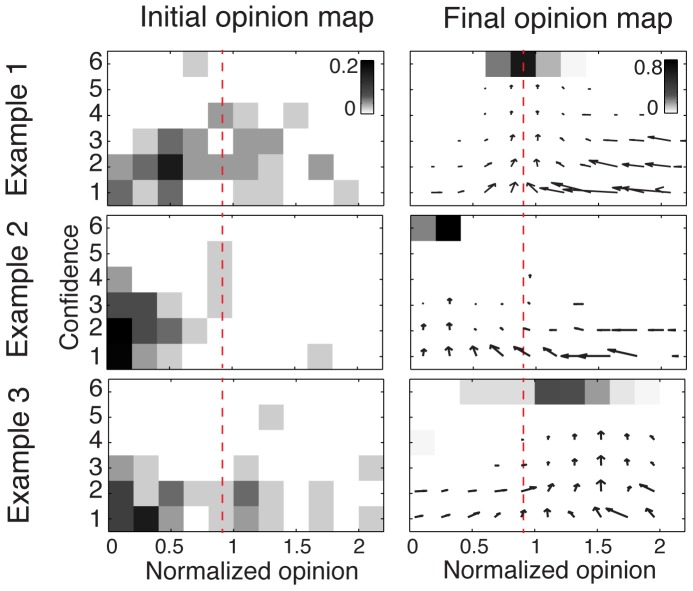
Figure 5. Three representative examples of the collective dynamics observed in the computer simulations.
For each example, the initial opinion map is shown on the left-hand side (experimental data), and the final opinion map after N = 300 rounds of simulations on the right-hand side. The opinion maps represent the proportion of individuals with a given opinion (x-axis) and a given confidence level (y-axis). As in Fig. 1, the normalized opinion is the actual opinion divided by the true value. The correct answer is represented by the red dashed lines (corresponding to a value of 1). Outliers with normalized opinion greater than 2 are not shown. The arrow maps represent the average movements over both opinion and confidence dimensions during simulations. Examples 1, 2, and 3 correspond to the questions “What is the length of the river Oder in kilometers? ”, “How many inhabitants has the East Frisian island Wangerooge?”, and “How many gold medals were awarded during the Olympics in China in 2008?”, respectively. The final convergence point may be determined by a dense cluster of low confidence individuals, as illustrated by Example 2 (majority effect), or by a few very confident individuals as in Example 3 (expert effect).

