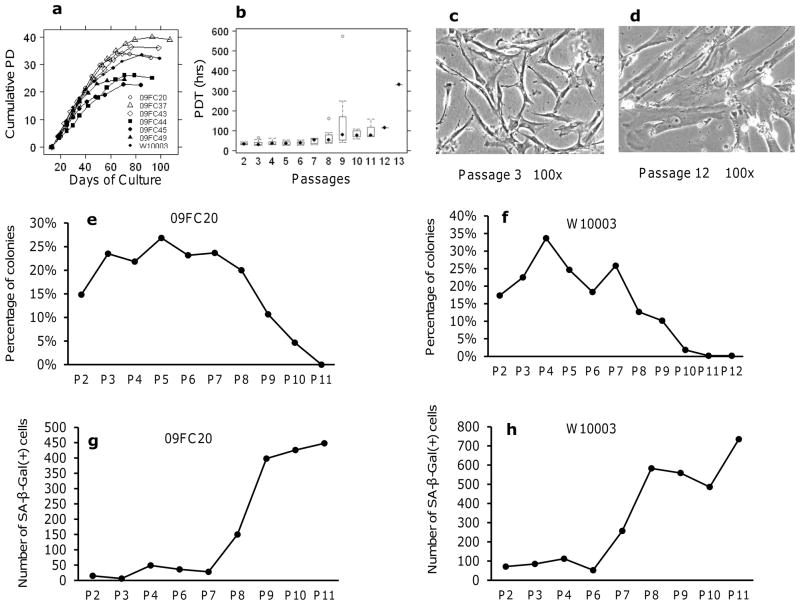
Figure 1. Growth kinetics, morphology, CFE and senescence of BMSCs.
(a): The Cumulative Population Doublings (PD) for 7 donors. Each line represents BMSCs from one donor and each symbol represents one passage. Population doublings (PD) of each passage were added up to get the cumulative PD. (b): The mean Population Doubling Time (PDT) of multiple donors at each passage. (c) Morphology of BMSC at early passage. (d) Morphology of BMSC at late passage. The CFE assay was performed on BMSCs from donor 09FC20 (e) and donor W10003 (f), data were normalized by the number of plating BMSCs. The numbers of SA β-gal positive cells of BMSCs from 09FC20 (g) and W10003 (h) at each passage were shown. Passage (P) was indicated below x-axis.

