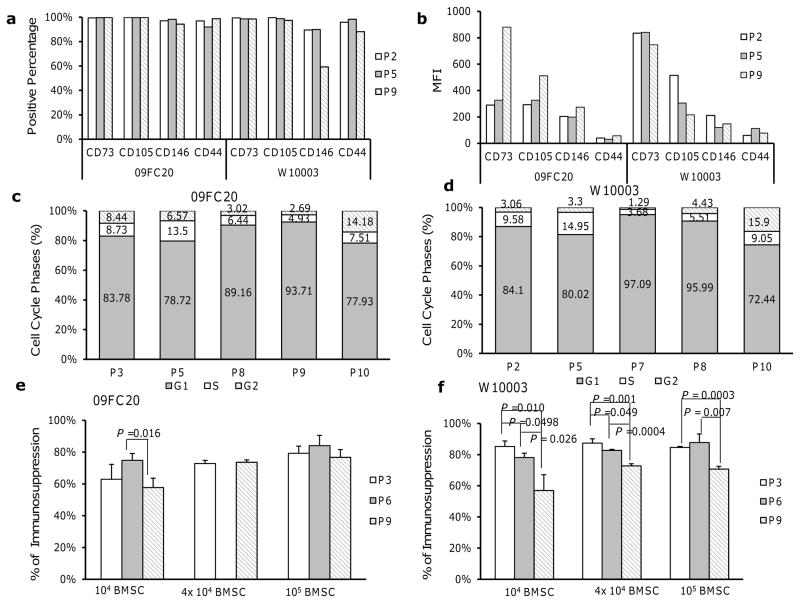
Figure 2. Surface marker, cell cycle phase and functional changes associates with BMSC expansion.
(a): The percentage of BMSCs expressing surface markers CD73, CD105, CD146 and CD44 from donor 09FC20 and W10003. (b): The mean fluorescence intensity (MFI) of surface markers for BMSCs from donor 09FC20 and W10003. (c): Results of cell cycle analysis on BMSCs from donor 09FC20. (d): Results of cell cycle analysis on BMSCs from donor W10003, passage (P), and cell cycle phage G1, S, G2 were indicated below x-axis. (e): The immunosuppressive effects of BMSCs from donor 09FC20. (f): The immunosuppressive effects of BMSCs from donor W10003. Number of BMSCs per well was indicated below the bars. Error bars indicated standard deviation. Statistical significances between passages 3, 6 and 9 were determined by two sample t-test, and P values were indicated above the bars.

