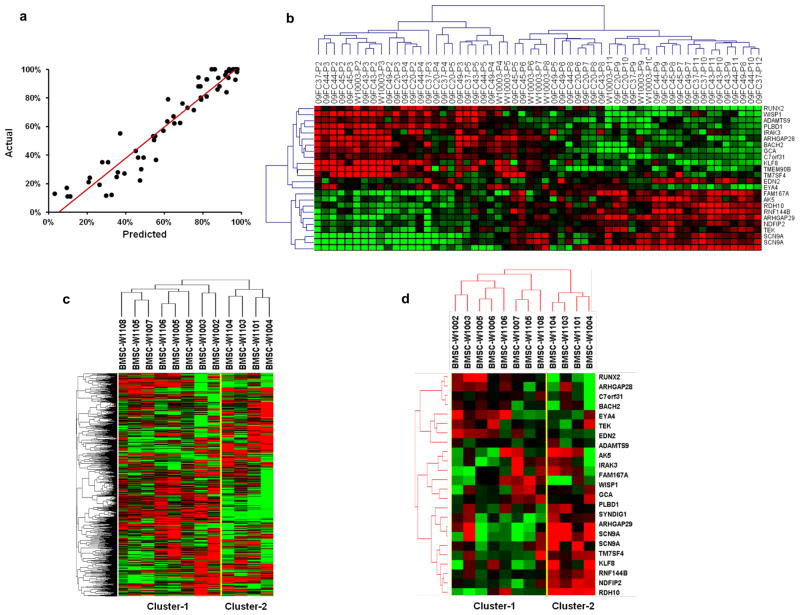
Figure 4. Prediction model of BMSC age.
(a): Scatter-plot of the actual life span vs the predicted life span of each sample (black dots) from the leave-one-donor-out cross-validation. (b) Hierarchical clustering analysis using the 24 age-predictive genes separated the 57 samples into one cluster of 25 earlier passage BMSCs and one with 32 later passage BMSCs, the later cluster contained one sub-cluster with intermediate passage cells and one sub-cluster of late passages. (c): Unsupervised hierarchical clustering separated the 12 clinical BMSC lots into two clusters: cluster-1 with 8 lots and cluster-2 with 4 lots. (d): Hierarchical clustering using the 24 age-predictive genes also separated the 12 lots into two clusters, one with 8 lots (cluster-1) and the other one with 4 lots (cluster-2).

