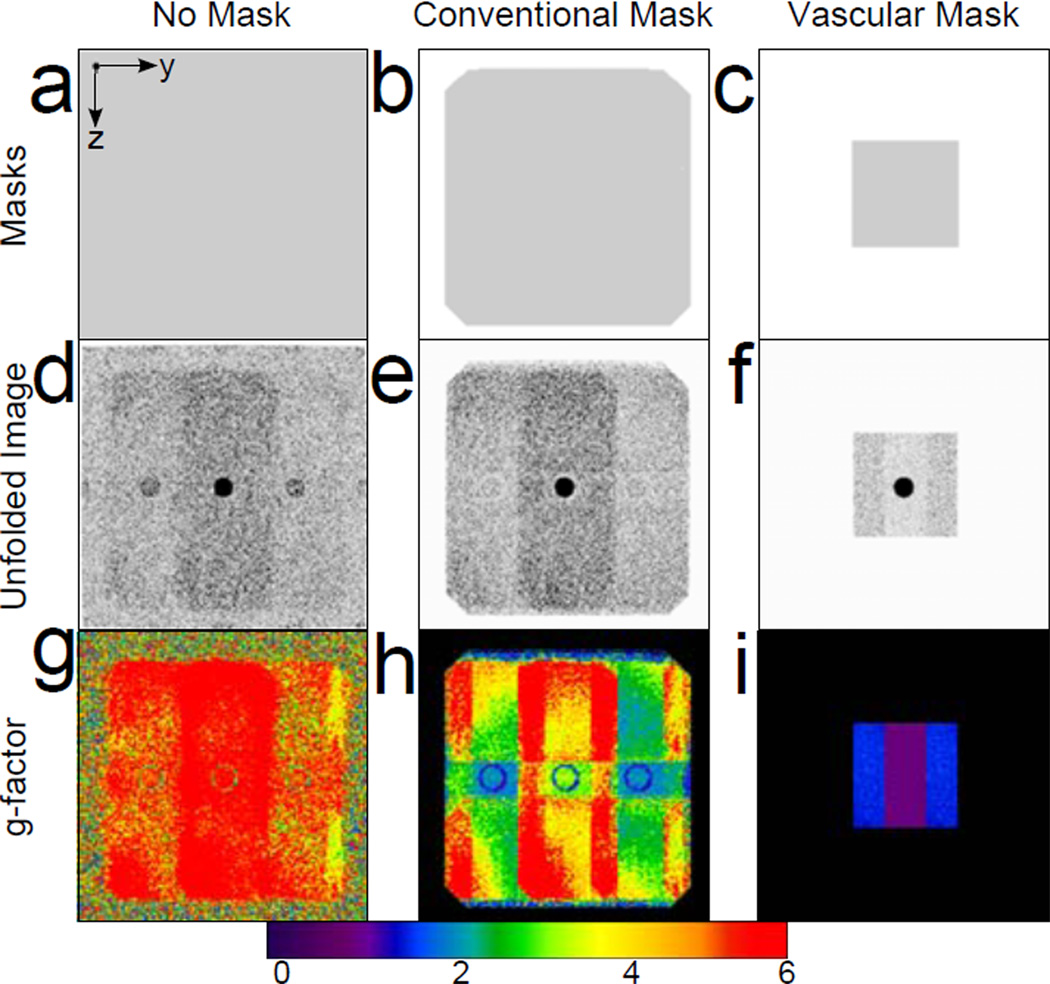
Figure 4.
A phase-encode plane axial partition of an RY × RZ = 4 × 2 accelerated image of the bovine gelatin phantom shows the difference in masks (a-c), unfolded subtracted images (d-f) and g-factor maps (g-i) for different voxel exclusion masks. Images reconstructed with no mask (a, d, g), the conventional mask (b, e, h), and the vascular mask (c, f, i) are shown.

