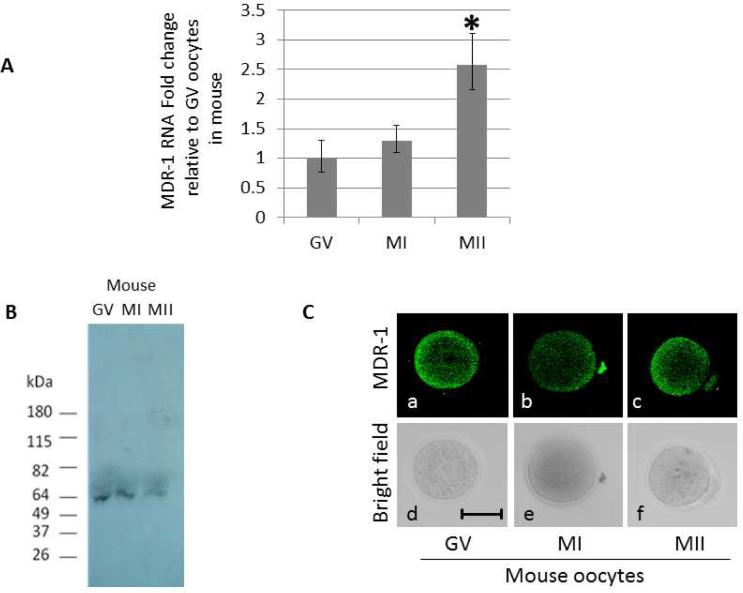
Figure 1.
Dynamic expression of MDR mRNA and protein during oocyte maturation in mouse. (A) MDR-1 RNA levels increase during oogenesis. Quantitative PCR was used to measure the RNA levels of MDR-1 in mouse oocytes at the indicated developmental stages: GV, MI and MII. All values were normalized against the β-actin RNA and represented as a fold change relative to the amount of RNA present in the GV oocytes. Significance was assessed between each developmental stage using Student's ttest, P<0.05. Significant differences (*) were obtained between GV and MII, and MI and MII. (B) MDR-1 protein expression. Western blot using an antibody against MDR-1 on GV, MI, and MII mouse oocytes. 50 oocytes were loaded in each group. (C) MDR-1 is expressed throughout the oocytes. Immunofluorescence using an antibody against MDR-1 on mouse oocytes, at GV (a), MI (b), and MII (c).The corresponding differential interference contrast images are respectively shown in d to f. Pictures were taken at 200x magnification. Scale bars, 50 μm.

