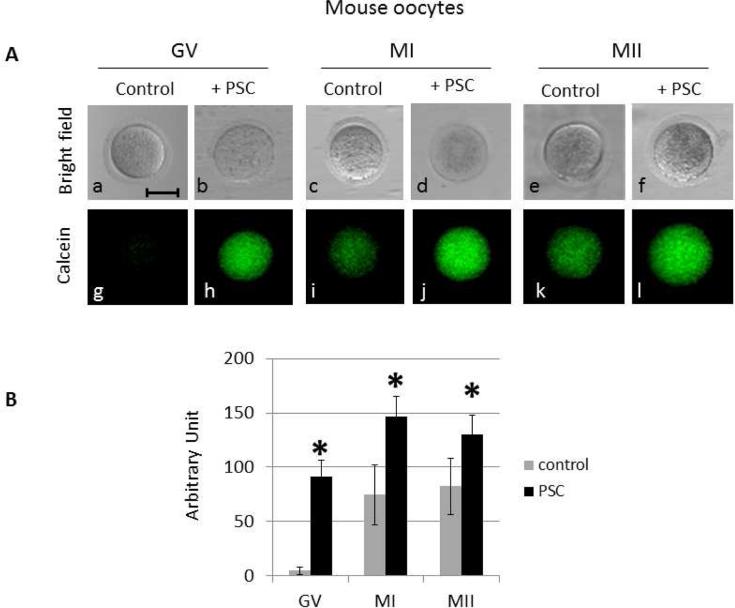
Figure 2.
MDR activity changes with oocyte maturation stage. (A) Mouse oocytes were incubated with calcein AM without (control: g, i,k) or with PSC 833 (PSC: h,j,l). The corresponding differential interference contrast images are respectively shown in a to f, at 200x magnification. Scale bar, 50 μm.(B) The fluorescence resulting from the calcein in the whole oocytes was quantified using metamorph. 12 GV, 7 MI and 8 MII were used for the quantification in the control, 9 GV, 4 MI and 7 MII were analyzed after the PSC833 treatment. Significance was assessed between control (without PSC) and PSC833 treated oocytes for each developmental stage using Student's ttest, P<0.005. Significant differences (*) were obtained for each stage.

