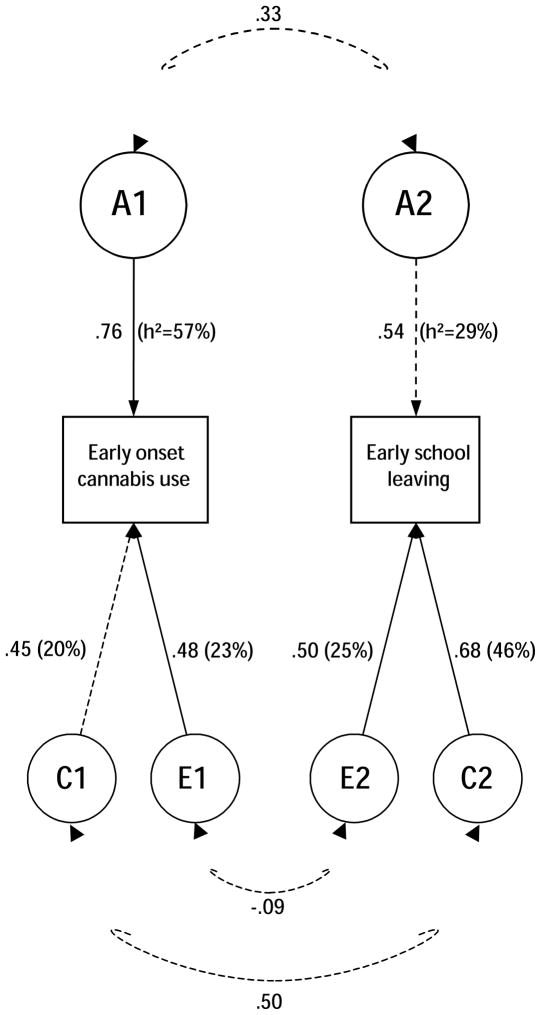
Figure 2.
Correlated factor model. Graphical presentation of the parameter estimates and proportions of variance in early-onset cannabis use and early school leaving accounted for by additive genetic (A), shared environmental (C) and residual influences (E). h2 (heritability) is the percentage of variance accounted for by genetic factors. The double-headed arrows represent the genetic, shared environmental and residual correlations, indicating the degree to which the same genetic or environmental factors are influencing the two traits. Broken lines represent non-significant paths (p>=0.05).

