
Figure 4. Circle of correlations from the principal component analysis of all traits.
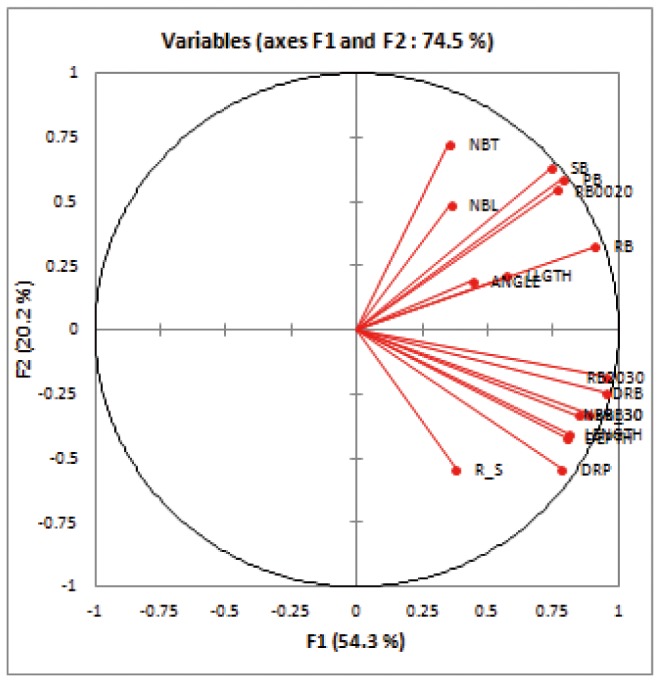
LLGTH = leaf length; NBT = tiller number, SB = shoot biomass; DEPTH = maximum depth reached by the roots in position; LENGTH = maximum root length; ANGLE = root cone angle; NBR_30 = number of roots below 30 cm; RB0020 = root mass in the 0-20 cm layer; RB2030 = root mass in the 20-30 cm layer; RBB30 = root mass below 30 cm; DRB = deep root biomass; DRP = deep root proportion; RB = root biomass; PB = plant biomass; R_S = root to shoot mass ratio .