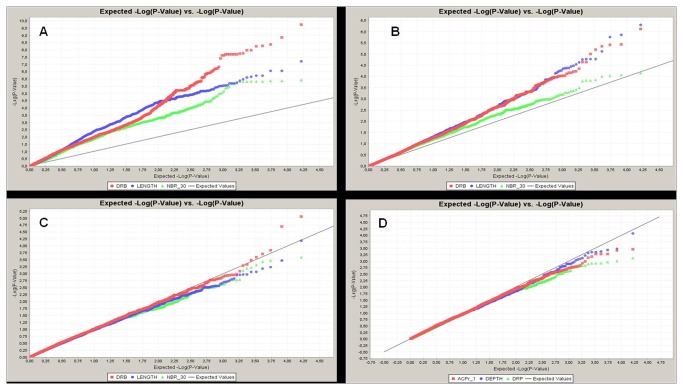
Figure 5. Quantile-quantile plots for four models for three selected traits.
A. Model without correction. B. GLM (correction for population structure). C. MLM1 (correction for kinship). D. MLM2 (correction for both population structure and kinship).
DRB = deep root biomass (red); LENGTH = maximum root length (blue); NBR_30 = number of roots below 30 cm (green).

