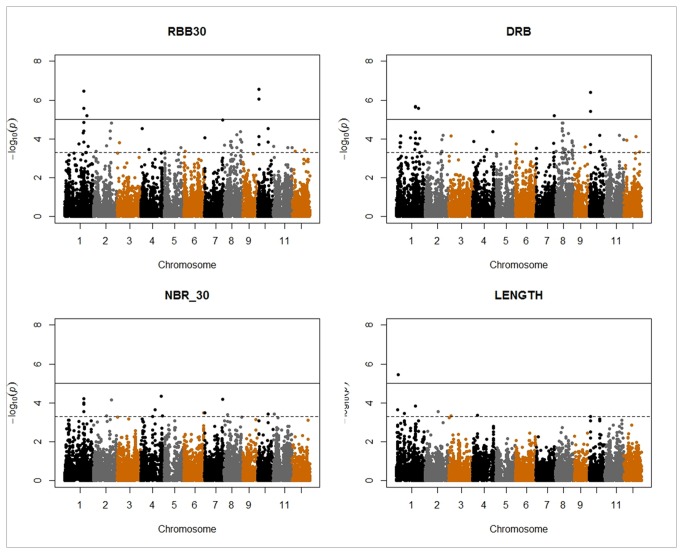
Figure 6. Manhattan plots for four selected root traits.
The negative log10-transformed p-values of each test are plotted against the marker position in the genome. Full line: P=1e-05; dotted line: P=5e-04.
RBB30 = root mass below 30 cm; DRB = deep root biomass; NBR_30 = number of roots below 30 cm; LENGTH = maximum root length; .

