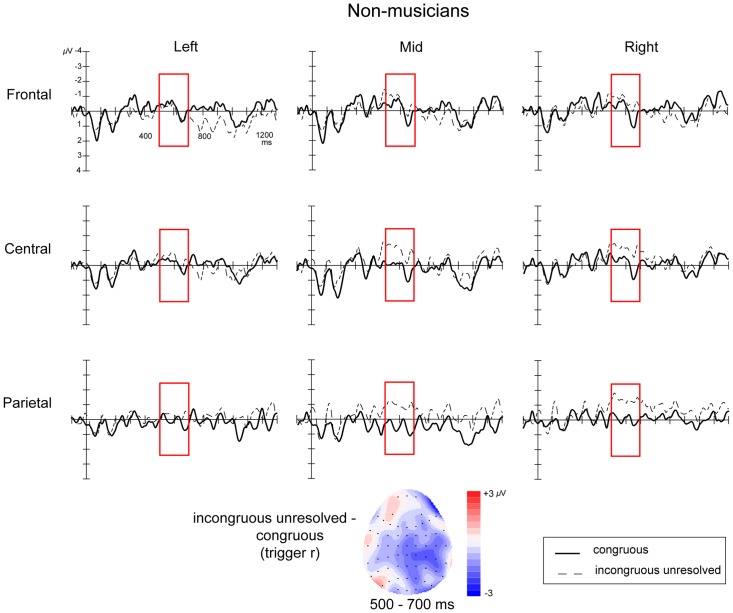
Figure 6. ERPs time-locked to the onset of the harmonic resolution, or lack thereof (trigger r) for non-musicians.
The figure shows the 9 electrode clusters used in the analyses. Negative is plotted upwards. Topographic map the distribution of the difference between incongruous-unresolved and congruous conditions averaged over the time window of interest (500–700 ms).

