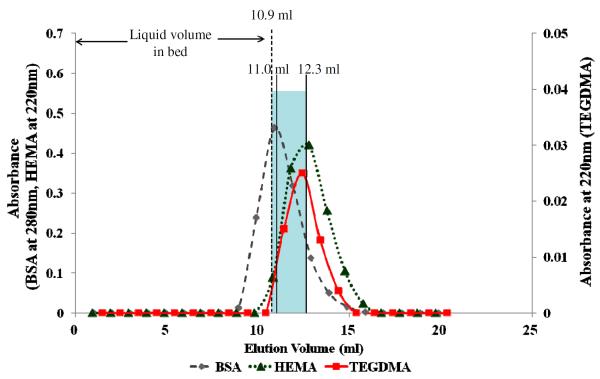
Figure 2.
Elution profile of BSA (◆), HEMA(▲) and TEGDMA(■) from mineralized dentin powder. The mean elution peak of BSA occurred at 11.0 ± 0.06 ml (n=4), while that of TEGDMA and HEMA occurred at 12.2 ± 0.12 and 12.3 ± 0.06 ml, respectively. The mean elution volumes for TEGDMA and HEMA were significantly larger (p<0.05) than for BSA, but the two monomer elution volumes were not significantly different from each other. Blue shading indicates that there was a small (1.3 ml) amount of water in the mineralized dentin.

