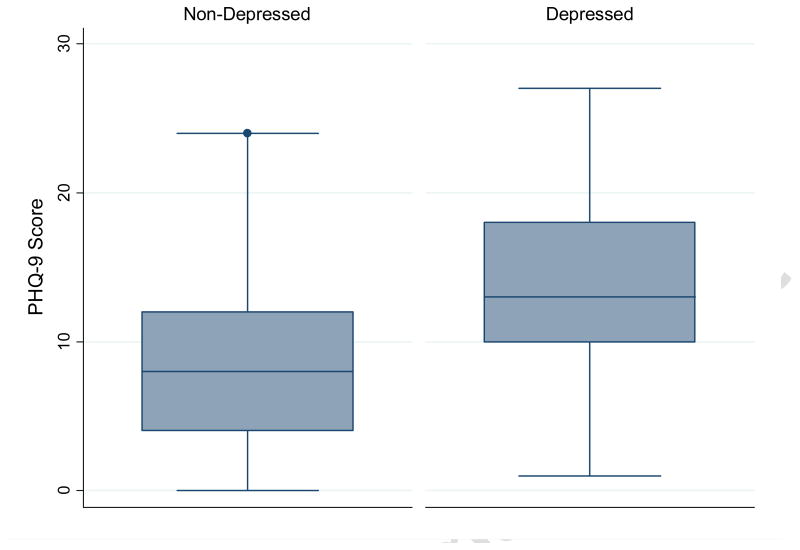
Figure 1. Distribution of PHQ-9 scores according to major depressive disorder status.
Box plots comparing PHQ-9 scores among those classified as having major depressive disorder (right side) and those without depression (left side) based on psychiatrist diagnosed major depressive disorder using the SCAN depression module. The central box shows the data between the upper and lower quartiles, with the median represented by the middle line. The “whiskers” (lines on either side of central box) extend from the upper and lower quartiles to a distance of 1.5×IQR (interquartile range) away or the most extreme data point within that range, whichever is smaller.

