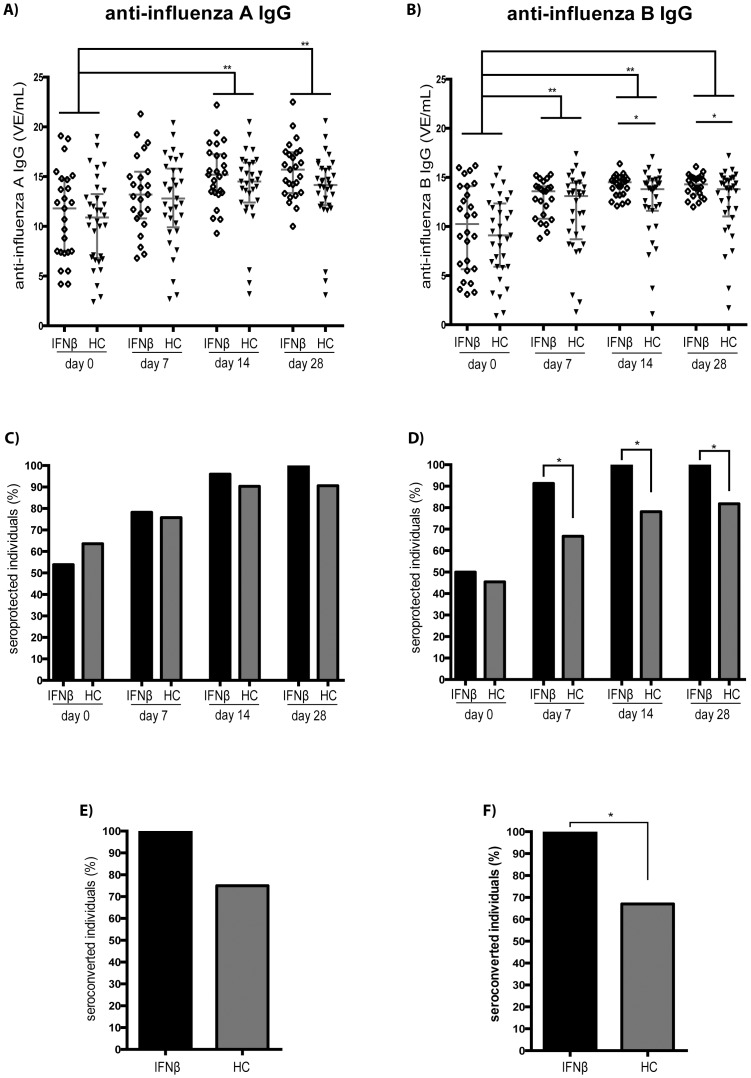
Figure 2. Anti-influenza IgG-response after influenza-vaccination in IFNβ-treated patients and in healthy controls.
The concentration of anti-influenza A (panel A) and anti-influenza B (panel B) IgG is shown as detected before (day 0) and at day 7, 14 and 28 after influenza vaccination in IFNβ-treated patients with MS (IFNβ) and healthy controls (HC) (red lines indicate the median ± IQR). The percentage of patients fulfilling IgG sero-protection criteria for influenza A (panel C) and influenza B (panel D) is shown before (day 0) and at day 7, 14 and 28 after influenza vaccination in IFNβ-treated patients with MS (IFNβ) and healthy controls (HC). The percentage of IFNβ-treated patients with MS (IFNβ), and healthy controls (HC), converting from sero-negative pre-vaccination to seroprotection following vaccination is shown for influenza A (panel E) and influenza B (panel F) (day 7–28). * indicates p< 0.05; ** indicates p< 0.001

