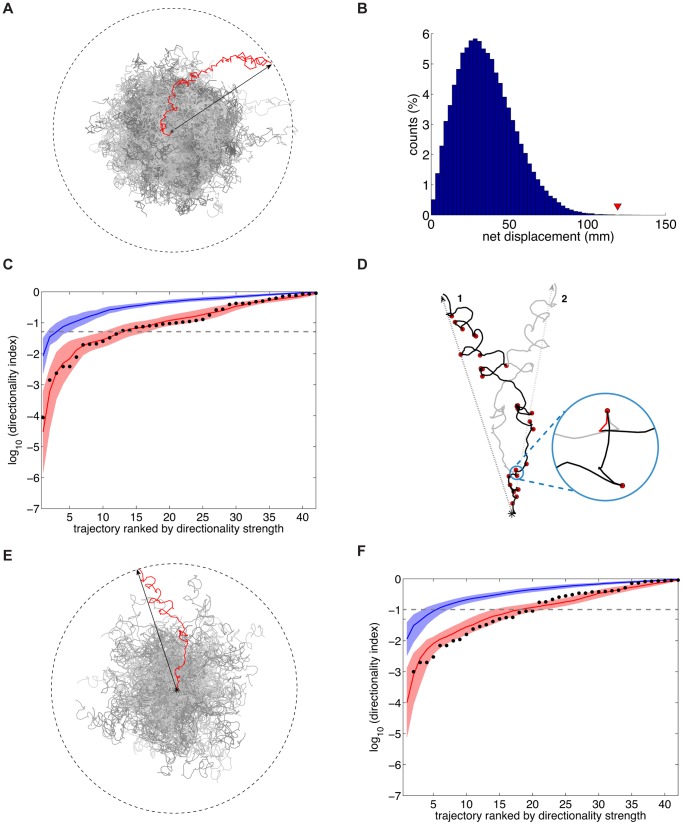
Figure 4. Random, isotropic motion does not account for directionality.
(A) Synthetic paths for the correlated random walk (‘CRW’) model were obtained by sub-sampling an experimental path at its correlation time, and by drawing at random from the step sizes and turning angles distributions of the resulting path (experimental path, red; synthetic paths, gray). Black arrow: experimental net displacement. (B) Histogram of net displacements for 100,000 synthetic paths corresponding to the trajectory in (A). The red triangle indicates the experimental value. The directionality index of a path equals the probability of obtaining, from the model, a larger or equal net displacement than the experimental one. (C) Directionality indices for the camera and the scanners data sets. Indices are plotted by rank (from most to least directional). Black dots: camera data. Red line: average of 20 samples from the scanner-array data set (‘average scanner data set’). Red shading: average scanners data set +/− one standard deviation (‘std’). Blue line: average of 20 samples from the CRW model. Blue shading: average of the CRW model +/− one std. (D) ‘Mirror’ model. The experimental path (in black) is segmented into ‘runs’ and ‘turns’ (red dots). Synthetic trajectories are obtained by inverting turns with probability ½, and by reassembling runs and turns by continuity (see Materials and Methods). One such path, obtained by inverting the turn highlighted in circular inset (red line), is displayed in gray. Black asterisk: position at time 0. (E) The directionality index of a path is defined as in (B). (F) Directionality indices for the mirror model. Indices are plotted by rank. Black dots: camera data. Red line: average scanners data set (CRW model). Red shading: average scanners data set +/− one std. Blue line: average of 20 mirror model samples. Blue shading: average mirror model +/− one std.

