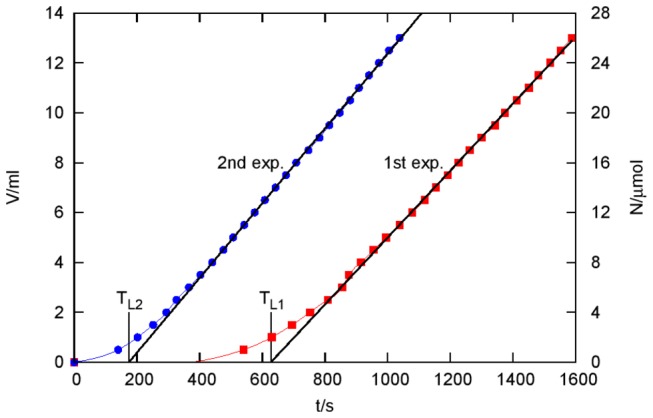
Figure 2. Permeation of ClO2 through a gelatin membrane as a function of time t.

Each point in the diagram represents a „black burst” (see Methods). V is the cumulative volume of the 0.01 M Na2S2O3 titrant added before the burst and N is the amount of ClO2 permeated until time t. T L1 = 627 s and T L2 = 175 s are time lags of the first and the second experiments, respectively. The concentration of ClO2 source in the magnetically stirred aqueous solution was 1360 ppm (mg/kg) or 20.1 mM.
