
Figure 2.
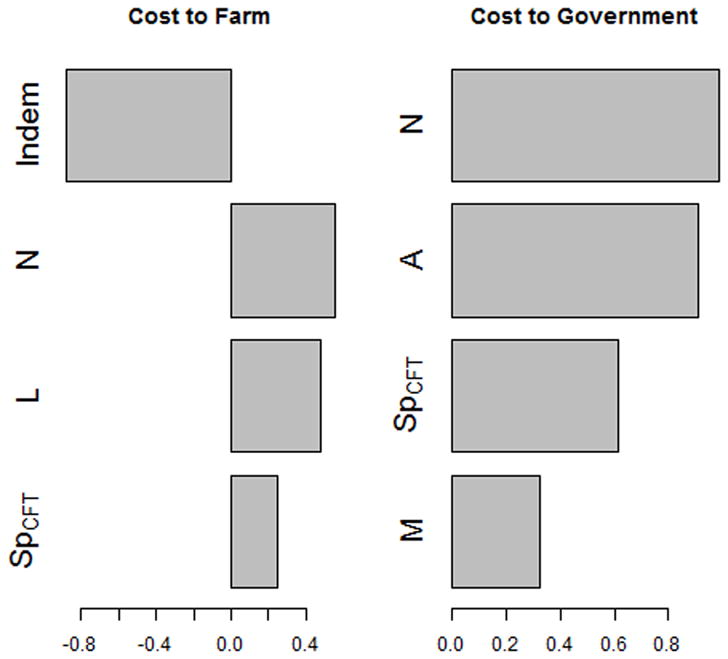
Partial rank correlation coefficient values from a global sensitivity analysis of all parameters used in the model of bovine tuberculosis control costs for an average dairy herd in California (Tables 1 and 2) under the optimal test-and-removal program, which consists of a 2 month testing interval with 2 negative whole-herd tests required to declare the herd free of infection. Only parameters with α<0.1 with the Bonferroni correction are shown. Indem is the indemnity cost per animal, N is the herd size, L is the monthly loss due to quarantine, SpCFT is the specificity of the CFT, A is the skin test administration cost per animal, and M is the number of miles traveled by the vet administering the skin test.