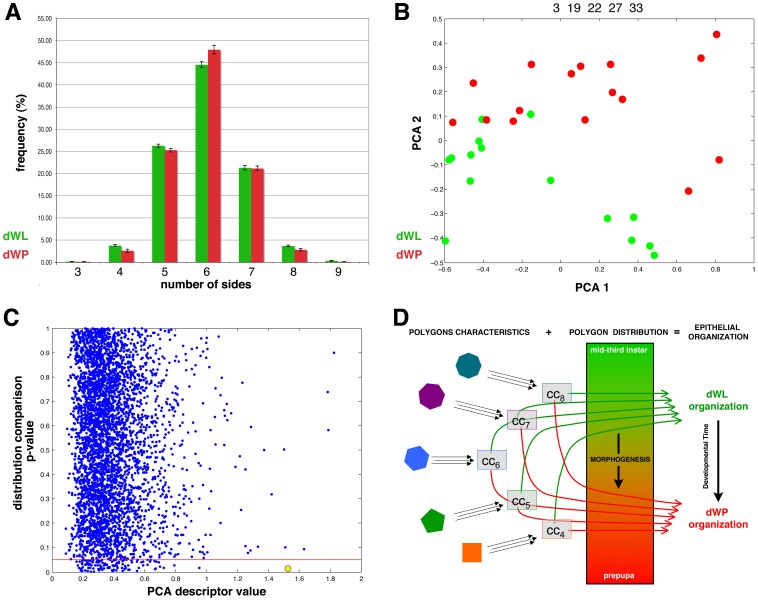
Figure 2. Epithelial organization differences between dWL and dWP.
A) Polygon distribution of dWL (15 datapoints, green) and dWP (16 datapoints, red) images. The frequency of each type of polygons in both sets of images is represented. The error bars represent the standard error B) PCA graph for the comparisons of dWL (green dots) and dWP (red dots) images using the selected characteristics (numbers 3, 19, 22, 27 and 33). C) Graph representing the 4000 random combinations of images (blue dots). The p-value resulting from the MANOVA test of the distribution comparison is plotted against the PCA descriptor value of the same random combination. The red line marks the p = 0.05. The graphs show the absence of correlation between both values. The yellow circle marks the dWL-dWP combination. Only four combinations present a higher PCA descriptor value. None random combination with p ≤0.05 shows a PCA descriptor greater than dWL-dWP combination. D) Model for control of tissue organization during the end of the proliferative larval stage. The morphogenetic signals in the wing disc drive a change in polygon distribution between mid-third instar larva and early prepupa. Our results also support the existence of two separable organizations in each of these developmental time-points. The model propose that the number of sides of the cells imposes geometric and organizational local constraints that in combination with a determined variation of the percentage of each polygon propagate in a change of the tissue epithelial organization.

