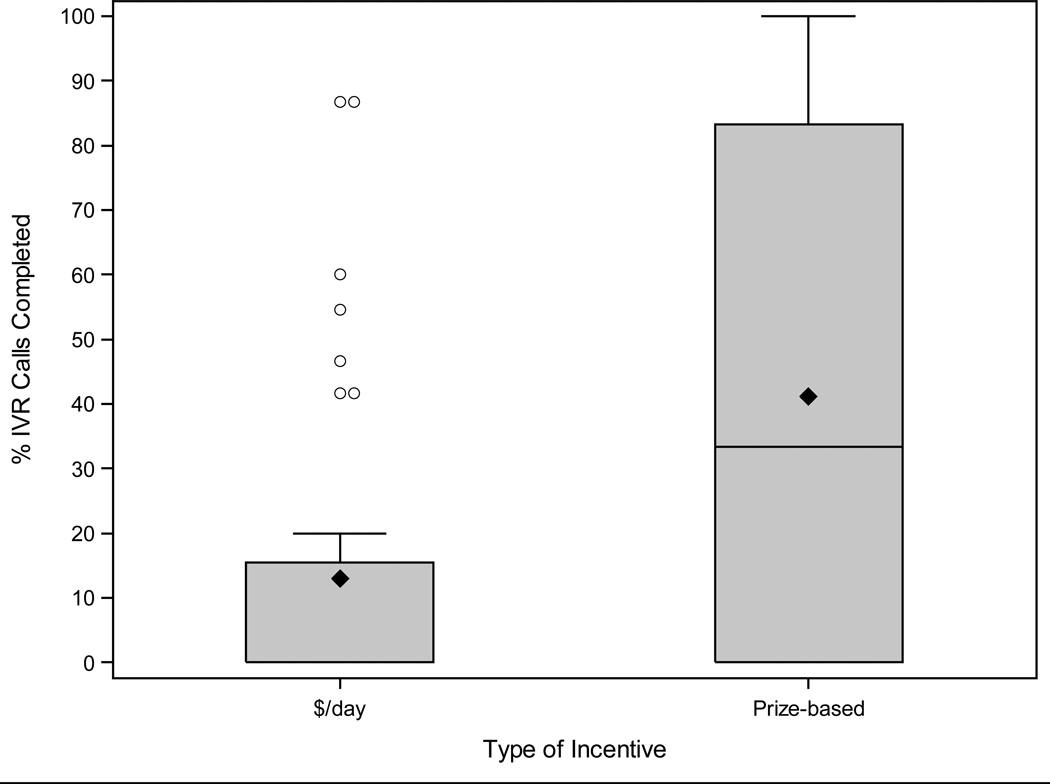
Figure 1.
Box plots for percent interactive-voice-response calls completed by contingency-management-incentive group with means (diamonds), medians (horizontal bars), interquartile range (box), and whiskers (1.5*IQR). The sample included 20 in the prize CM group and 37 in the fixed-dollar group. Circles represent outliers, defined as values more than 1.5 interquartile range above the median.

