
Figure 3. Similar glucose tolerance in WT and KO mice fed HF and HFA diets.
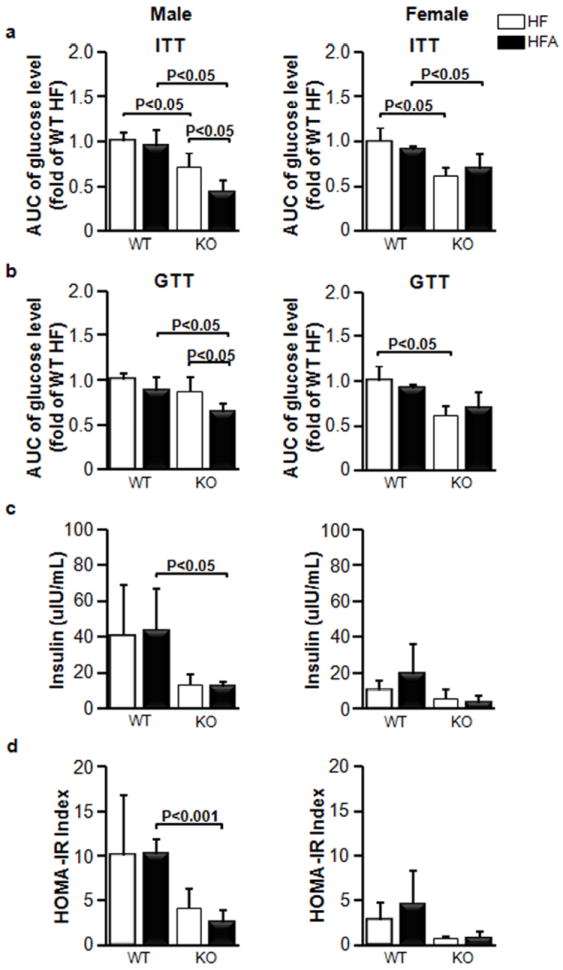
Comparison of areas under the curve (AUC) for (a) insulin tolerance tests (ITT) and (b) glucose tolerance tests (GTT) in WT and in KO male and female mice after 120 days on HF and HFA diets. (c) Fasting blood insulin levels in the mice after 120 days of treatment on HF and HFA diets. (e) Homeostasis Model of Assessment of Insulin Resistance (HOMA-IR) for the mice after 120 days of treatment on HF and HFA diets. Data are shown as mean±SD. The p-values were calculated by Student’s t-test. (n=4 for all mouse groups for ITT and GTT tests; n=5 for insulin measurements).