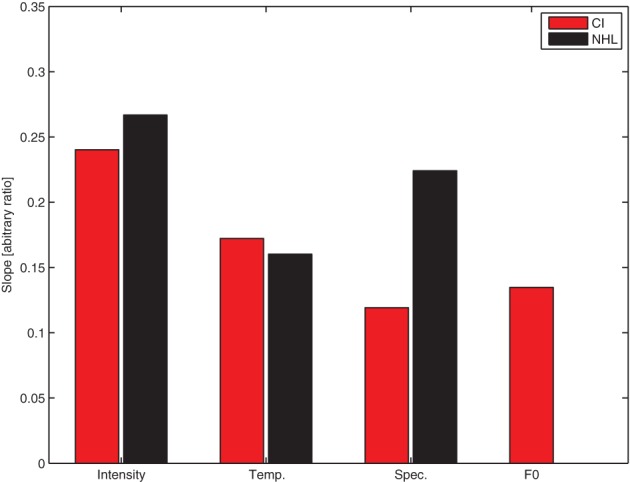
Figure 4.

The slope of the regression line between the physical parameter step and the MDS coordinate for the cochlear implant users in each condition in the current study (red bars), compared with the same results from our previous study in normal hearing listeners (Marozeau et al., 2013, black bars). The F0 was not tested in the normal hearing listeners (NHL).
