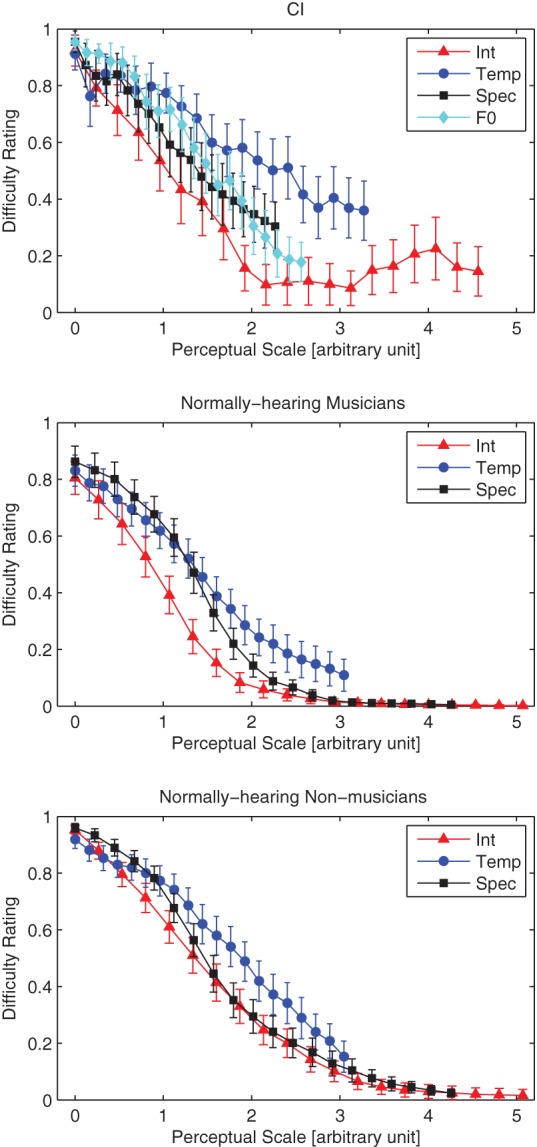
Figure 5.

Replots the difficulty ratings from Experiment 1, but with a different abscissa based on a perceptual scale determined from dissimilarity ratings (Experiment 2). The error bars show the standard error of the mean.

Replots the difficulty ratings from Experiment 1, but with a different abscissa based on a perceptual scale determined from dissimilarity ratings (Experiment 2). The error bars show the standard error of the mean.