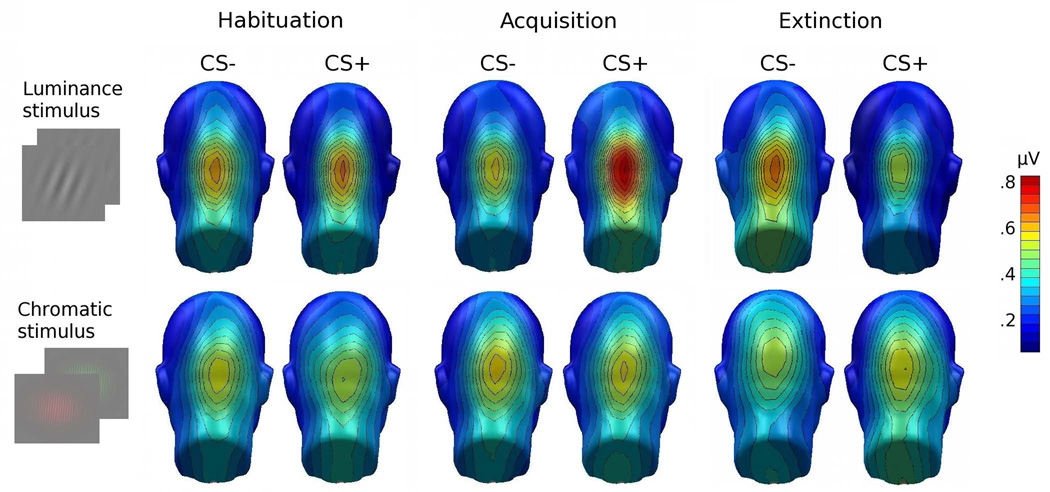
Figure 5.
Topographical representations of the grand mean spectral amplitude, across reversal frequencies (n = 26), comparing ssVEP amplitude in response to the CS+ and CS− gratings, across all experimental phases, and for the luminance (top row) versus chromatic gratings (bottom row). Spectra were calculated on the last 3200 ms of the time-domain averaged ssVEPs, where US presentation is imminent in the CS+ condition. Maps are generated by means of spherical splines, including extrapolations to locations below the electrode array (Junghöfer et al., 1997).

