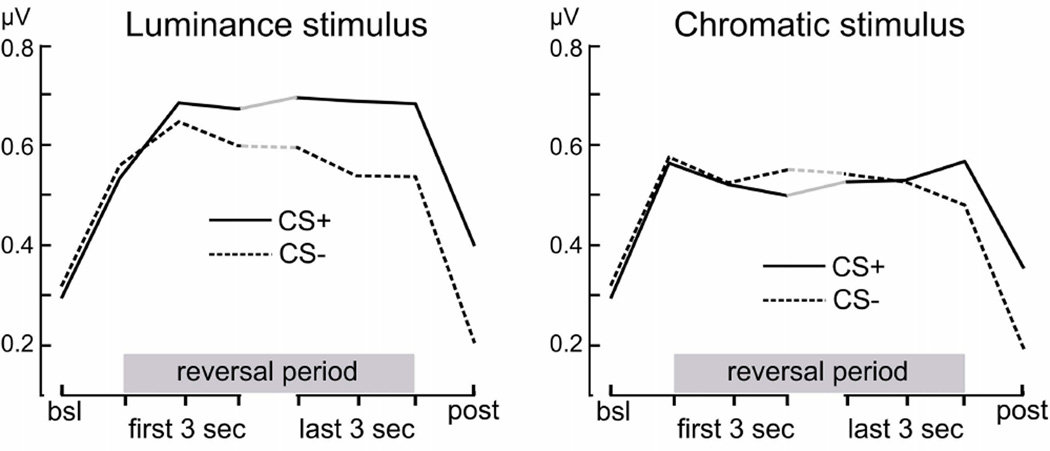
Figure 6.
Grand mean (n = 26) time course of ssVEP amplitude measures across the viewing epoch, during the acquisition phase, shown separately for luminance and chromatic CS+ and CS− stimuli. Values represent spectral power at the reversal frequencies during an initial pre-stimulus baseline, during the first and last 3 seconds of reversal stimulation, and during the post-CS time window. Differential amplification of the luminance CS+ ssVEP increases over time and reaches a maximum at the end of the CS presentation.

