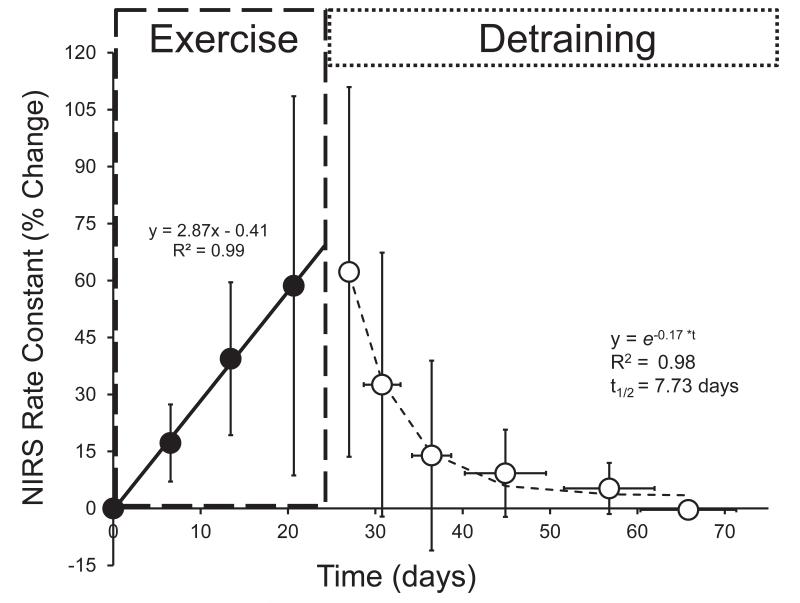
Figure 3.
Percentage change in NIRS rate constant (proportional to mitochondrial capacity) from baseline (time = 0 days) of the training arm. Data from all participants were averaged prior to the calculation of fitting parameters. Data from the training portion were characterized using simple linear regression. Detraining data were fit to a monoexponential decay function and half-times were calculated (t1/2). Data are presented as the mean ± SD (error bars).

