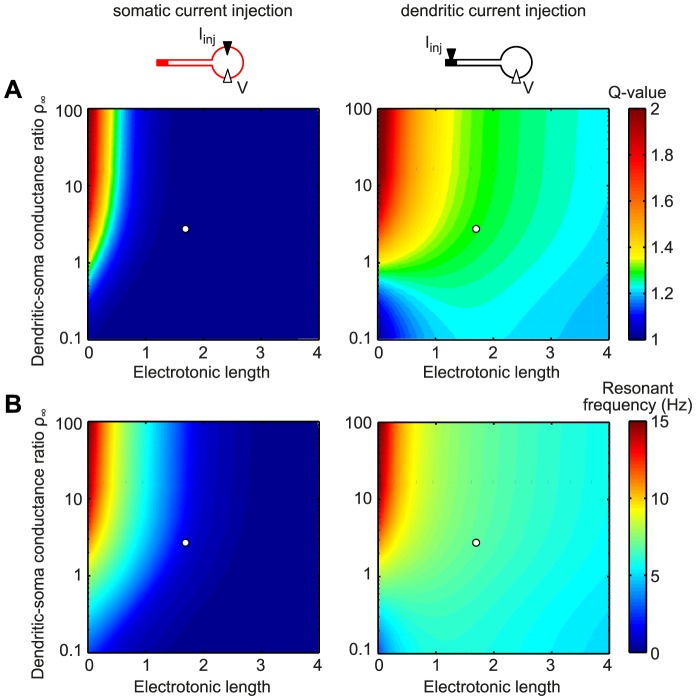
Figure 4. For electrotonically large cells the origin of input determines the “visibility” of dendritic resonance in somatic measurements.
Color-coded Q-value (A) and resonant frequency (B) of the somatic input impedance (left panels) and the dendro-somatic transfer impedance (right panels). The somatic input impedance exhibited a resonance only for short electrotonic lengths and large dendritic-soma conductance ratios  . In contrast, the transfer impedance showed a resonance across the whole parameter range with the exception of cells that are electrotonically small and have a low dendritic-soma conductance ratio. White circles correspond to the default model with electrotonic length
  and conductance ratio
  .
.

