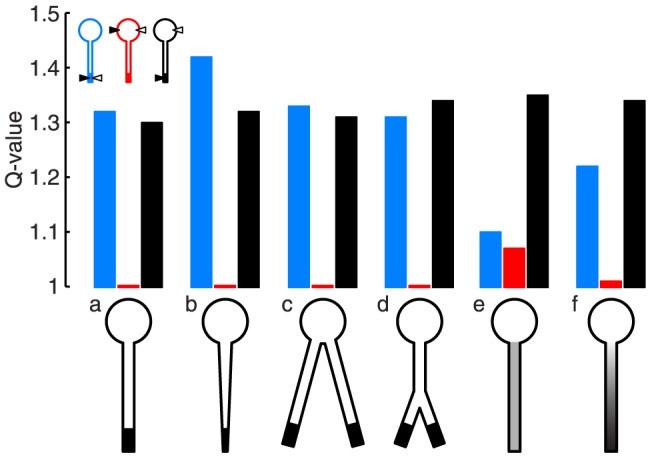
Figure 5. Differential filtering of somatic and dendritic input persists for a variety of cell morphologies and a gradual distribution of the active current.

Q-values of the dendritic input impedance (blue), somatic input impedance (red), and dendro-somatic transfer impedance (black). a: The default model from Figures 1B, 2C, 3, and 4 (length of passive cable  m, length of active distal end
  m, dendrite diameter
  m, peak conductance in active segment
  nS). b: Tapering of diameter towards the dendritic end (dendrite diameter gradually decreases from
  m to
m to  m). c: Neuron with two dendrites, both with the same parameters as model a. d: Branching neuron (length of primary dendrite
  m, length of passive parts of both daughter dendrites
  m, length of active dendritic ends
  m). e: Uniform distribution of h-conductances (peak conductance density
  mS/cm
mS/cm ). f: Exponential distribution of h-conductances (
 S/cm
S/cm ). Note that the total h-conductance and the length of the path between distal dendritic end and the soma were the same in all considered cases.
