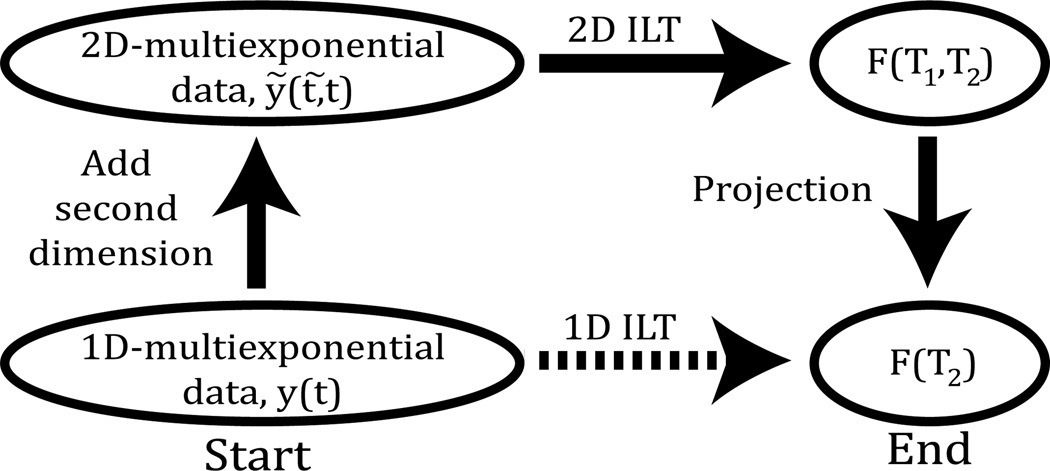
Figure 1.
Dashed arrow indicates the 1D ILT of multicomponent decay data consisting of decaying exponentials, resulting in a T2 histogram. The path traversed by the solid arrows introduces a second dimension to the data with a distinct, indirectly-sampled time variable t̃, representing e.g. the inversion time in a T1 measurement. The T2 histogram is then obtained by applying a 2D ILT to the two-dimensional data and then projecting the resulting T1−T2 histogram onto the T2 axis.

