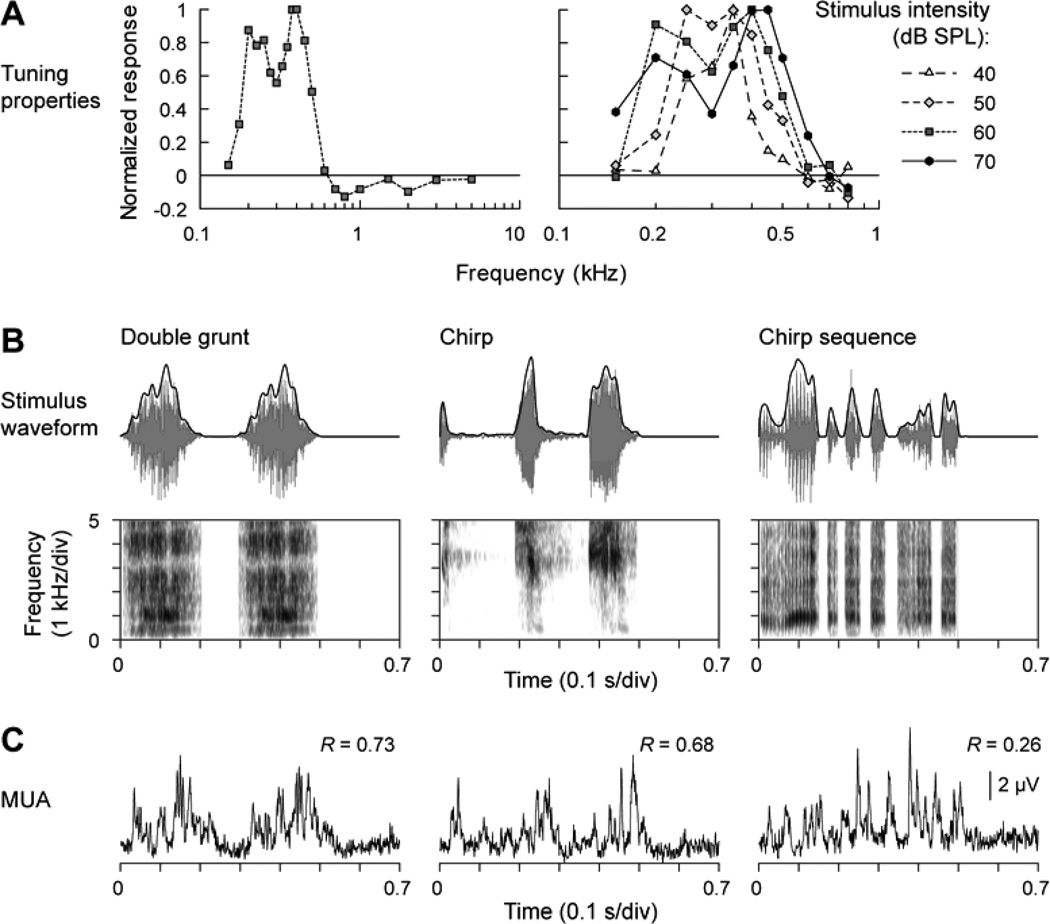
Fig. 1.
Representation of the temporal envelope of monkey vocalizations in monkey A1. A. Frequency response functions describing the spectral selectivity of the studied multiunit cluster. Left panel: responses to 60 dB SPL tones, presented at frequencies between 0.15 and 5 kHz. Right panel: responses to tones, presented at intensities ranging from 40 and 70 dB SPL, and frequencies between 0.15 and 0.8 kHz. B. Top row: Stimulus waveforms (gray) and temporal envelopes (black) of the three vocalizations. Bottom row: Stimulus spectrograms. C. MUA recorded from lower lamina 3. Numbers indicate peak values of the cross-correlograms between vocalization envelopes and MUA.

