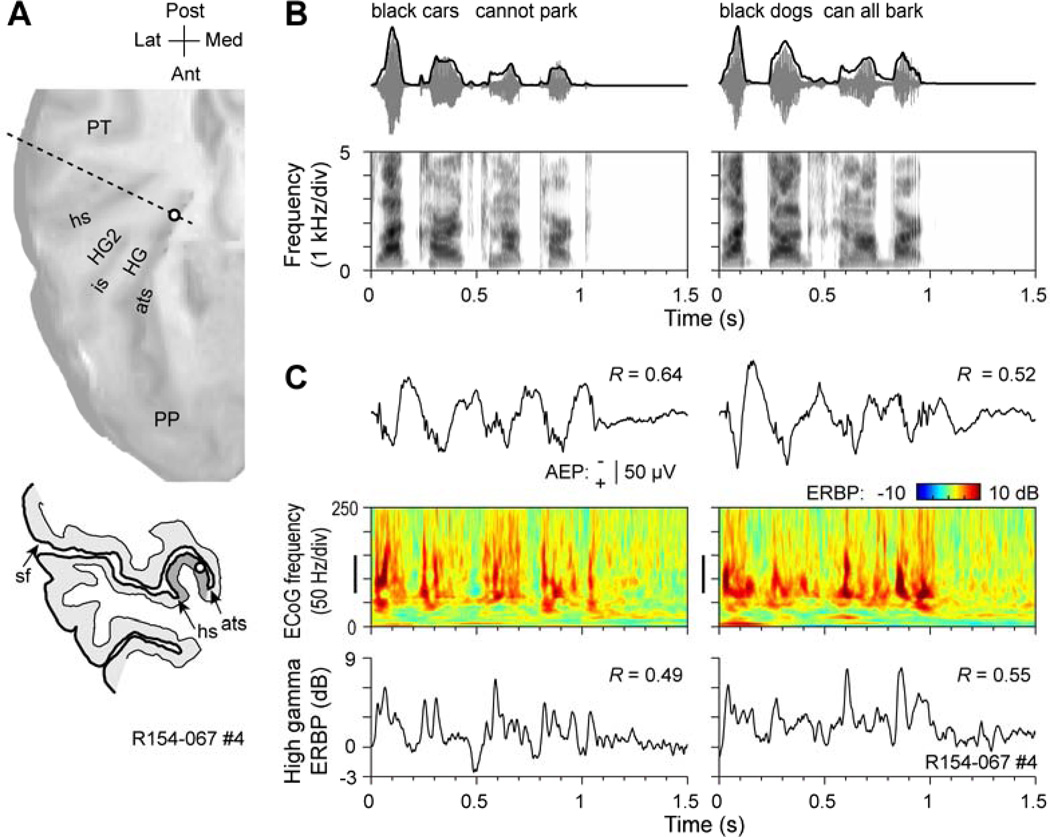
Fig. 2.
Representation of the temporal envelope of speech in human auditory cortex. Data set from Nourski et al. (2009). A. Location of the recording contact (open circle). MRI surface rendering of the superior temporal plane and tracing of the MRI cross section (dashed line) are shown in the top and bottom panels, respectively. HG, Heschl’s gyrus; HG2, second transverse gyrus, PP, planum polare; PT; planum temporale; ats, anterior temporal sulcus; is, intermediate sulcus; hs, Heschl’s sulcus; sf, Sylvian fissure. B. Top row: Stimulus waveforms (gray) and temporal envelopes (black) of the two speech sentences. Bottom row: Stimulus spectrograms. C. Responses to the speech sentences. AEP waveforms, ERBP time-frequency plots and high gamma ERBP waveforms are shown in the top, middle and bottom row, respectively. Vertical bars in ERBP time-frequency plots indicate high gamma frequency range. Numbers indicate peak values of the cross-correlograms between stimulus envelopes and AEP and high gamma ERBP waveforms. Negative voltage of the AEPs is plotted upwards.

