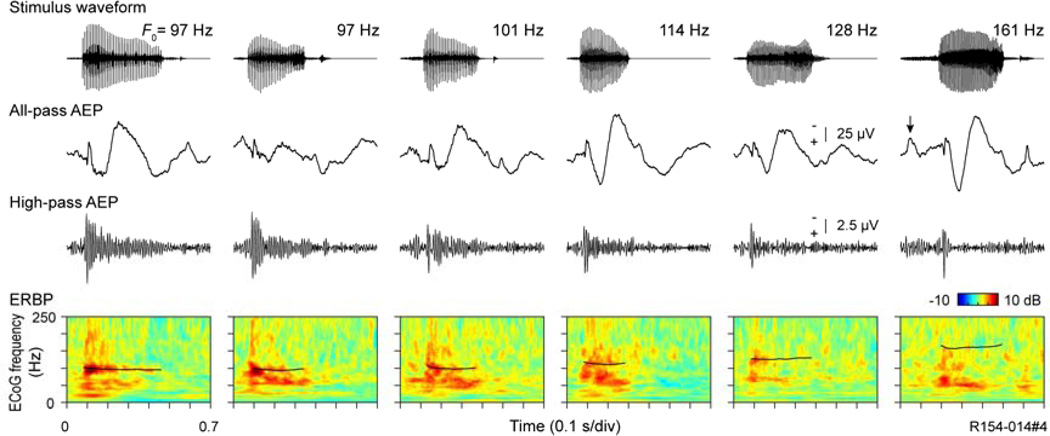
Fig. 7.
Representation of voice F0 in human auditory cortex. Same recording site as in Figures 2 and 5. Top to bottom rows: stimulus waveforms (word “had”, articulated by six male speakers, left to right); all-pass (1.6–500 Hz) AEP waveforms, high pass (>70 Hz) AEP waveforms, time-frequency ERBP plots with superimposed pitch contours (black curves).

