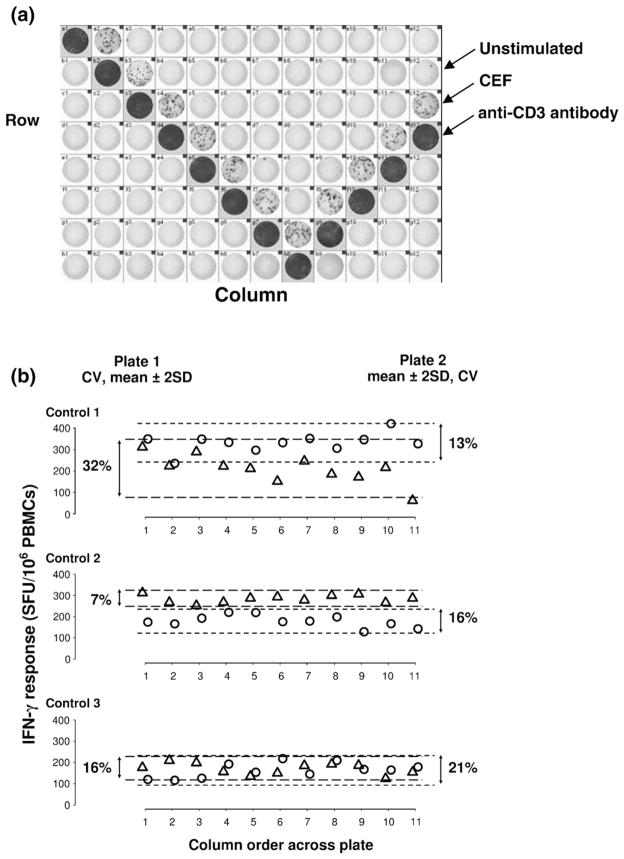
Fig. 2.
(a) V-formation of 96-well plates set up to assess plate variation in automated ELISpot assays measuring IFN-γ responses to 2 μg/mL of CEF and anti-CD3 antibody. (b) Responses from Three healthy individuals (plate 1: △, plate 2: ○) to either anti-CD3 (Control 1) or CEF (Controls 2 and 3) chosen according to measurability (range of 100–500 SFUs/106 PBMCs). Intra-assay CVs are provided for each plate, together with dotted lines indicating 2 standard deviations above and below the plate means. The average inter-assay CV was 23%.

