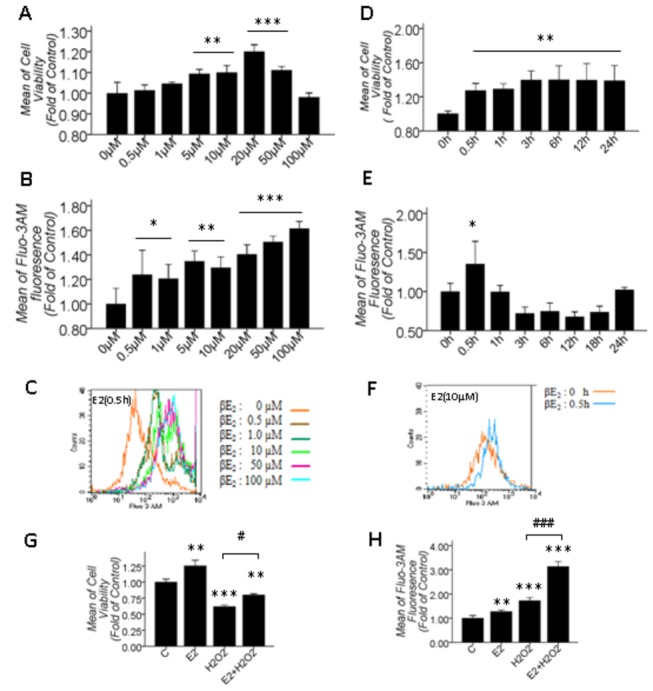
Figure 2. 10 μM βE2 pretreatment for 0.5 hrs played a protective role in primary cultured SD rat retinal cells, which was associated with a transient and rapid increase in [Ca2+]i.

A, B: Cell viability and [Ca2+]i quantitative data under different βE2 concentrations for 0.5 hrs; D, E: Cell viability and [Ca2+]i quantitative data at different time points after 10 μΜ βE2 treatment; C, F: The overlay figure of representative statistical significance for B and E; G, H: Cell viability and [Ca2+]i quantitative data after 10 μM βE2 pretreatment for 0.5 hrs and 100 μM H2O2 treatment for 2 hrs. Values shown are the Mean ±SD. *represents P<0.05, **represents P<0.01 and ***represents P<0.001 compared with the control group; # represents P<0.05 and ### represents P<0.001 compared with the H2O2 application group by one-way ANOVA statistical analysis. (A, D: n indicates 3 independent replicates with 4 samples per condition per experiment; B, E: n indicates 3 independent replicates with 5 samples per condition per experiment; G, H: n indicates 3 independent replicates with 6 samples per condition per experiment.).
