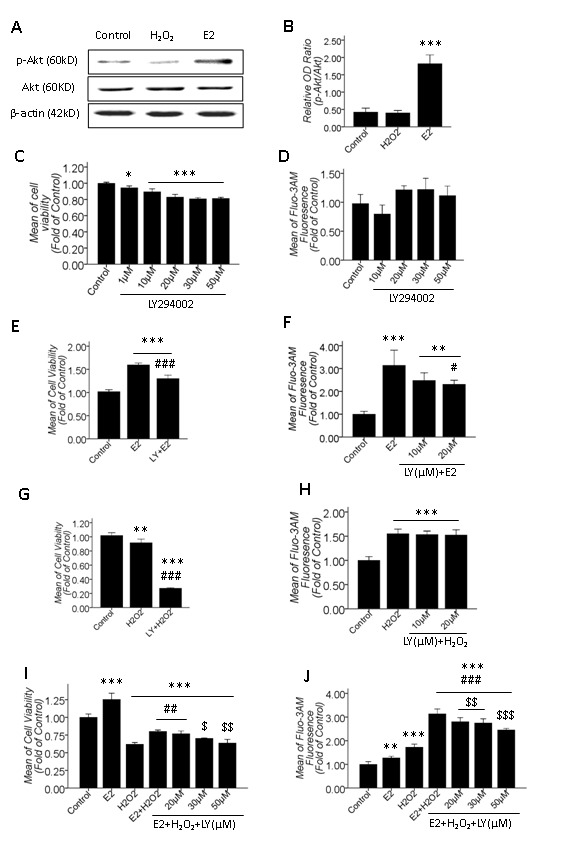
Figure 5. The effect of the PI3K inhibitor LY294002 (LY) on the cell viability and the [Ca2+]i of primary cultured SD rat retinal cells in H2O2 injury and βE2 protection.

A: Western blot results of the activation of the PI3K/Akt pathway after βE2 treatment for 0.5 hrs; B: Quantitative data of A; C, E, G, and I: Cell viability quantitative data; D, F, H, and J: [Ca2+]i quantitative data; C and D: The effects of LY treatments for 24 hrs and 0.5 hrs on the cell viability and the resting [Ca2+]i; E and F: The inhibitory effect of LY pretreatment for 0.5 hrs on the increased cell viability and [Ca2+]i induced by 10 μM βE2 treatment for 0.5 hrs (10 μM LY in E, 10 μM and 20 μM LY in F); G and H: The effect of LY pretreatment for 0.5 hrs on the decreased cell viability and increased [Ca2+]i induced by 100 μM H2O2 treatment for 2 hrs (10 μM LY in G, 10 μM and 20 μM LY in H); I and J: The dose-dependent attenuating impact of 20-50 μM LY pretreatment for 0.5 hrs on the βE2 retinal protective role against H2O2 injury, which is associated with the dose-dependent attenuation of the increased [Ca2+]i (Protocol of drug application: LY for 0.5 hrs, E2 for 0.5 hrs and H2O2 for 2 hrs). Values shown are the Mean ±SD. *represents P<0.05, **represents P<0.01 and ***represents P<0.001 compared with the control group; # represents P<0.05, ## represents P<0.01 and ### represents P<0.001 compared with the βE2 (E, F) or H2O2 (G, I, J) application groups; $ represents P<0.05, $$ represents P<0.01 and $$$ represents P<0.001 compared with the βE2 and H2O2 co-application group by one-way ANOVA statistical analysis. (B: n indicates 3 independent replicates; C, E, G, I: n indicates 3 independent replicates with 4 samples per condition per experiment; D, F, H, J: n indicates 3 independent replicates with 5 samples per condition per experiment.).
