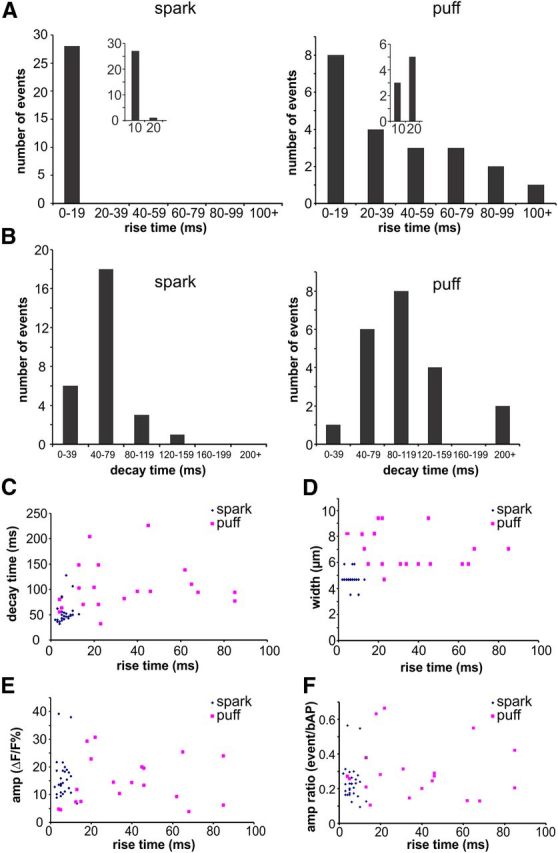
Figure 3.

Comparison of event parameters for sparks and puffs. A, Histograms of rise times (10–90%) for sparks and puffs. The insets show the first 20 ms bin divided into two parts. All sparks had fast rise times, most under 10 ms. Puff rise times ranged between 4 and 100 ms, with only three events faster than 10 ms. B, Histograms of half-decay times for sparks and puffs. Puffs had slower decay times than sparks, but the difference was not as strong as the difference in rise times. C, Scatter plot of rise and decay times of sparks and puffs. Puffs were slower and more heterogeneous than sparks. There was no clear correlation between the rise and decay times for either event type. D, Scatter plot of event width and rise time. Puffs were wider, but there was no clear correlation between width and rise time. E, Scatter plot of event amplitude and rise time. There was no clear difference in amplitude between sparks and puffs and no clear correlation between amplitude and rise time for either event type. F, Scatter plot of event amplitudes, normalized to the amplitude of a bAP signal at the same locations, versus rise time.
