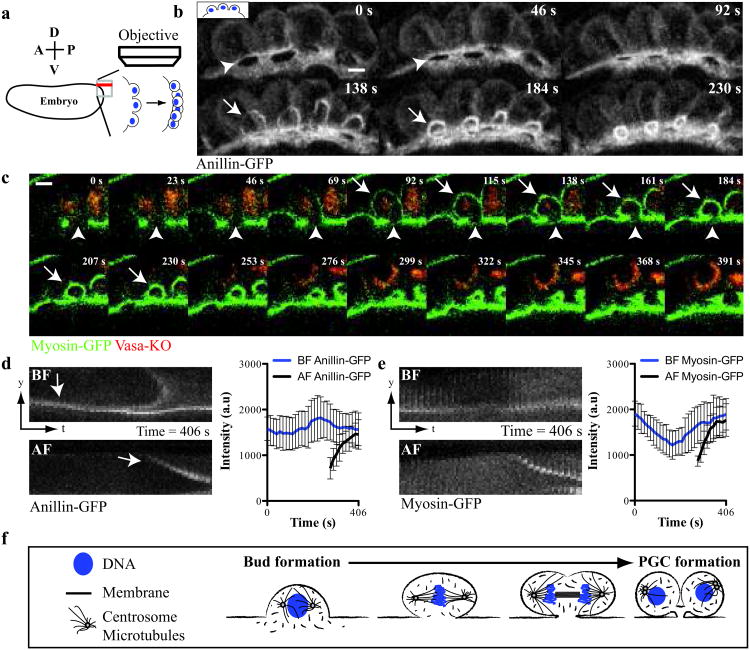
Figure 1. Anillin-GFP and Myosin-GFP localize to paired cleavage furrows during Drosophila PGC formation.
(a) Diagram of 4D-imaging strategy used to capture PGC formation at the posterior of the Drosophila embryo. The embryo is positioned with its dorsal surface closest to the cover slip. 40 Z-slices (red line) spaced 1 μm apart along the dorsal-ventral axis were acquired per time point at the apex of the posterior pole. (b) Micrographs of time-lapse maximum intensity projections (MIP) of paired furrows during PGC formation revealed with Anillin-GFP (see Supplementary Video 1). (c) Time-lapse micrographs (single optical sections) of a single bud during PGC formation revealed by Myosin-GFP and Vasa-KO (see Supplementary Video 2). (b, c) Arrows and arrowheads mark the anaphase furrow (AF) and bud furrow (BF) respectively. (d and e) Kymographs showing the localization and quantification of (d) Anillin-GFP and (e) Myosin-GFP at a single paired furrow during PGC formation. We consistently observed biphasic enrichment of Myosin-GFP at the BF suggesting regulation by the cell cycle as previously reported31. Data shows the mean of quantifications done in (d) = 4 embryos and (e) = 4 embryos, with 3 buds measured in each embryo. Error bars: S.D. (f) Graphical description of PGC formation showing the remodeling of one bud into two cells. Scale bars = 5 μm

