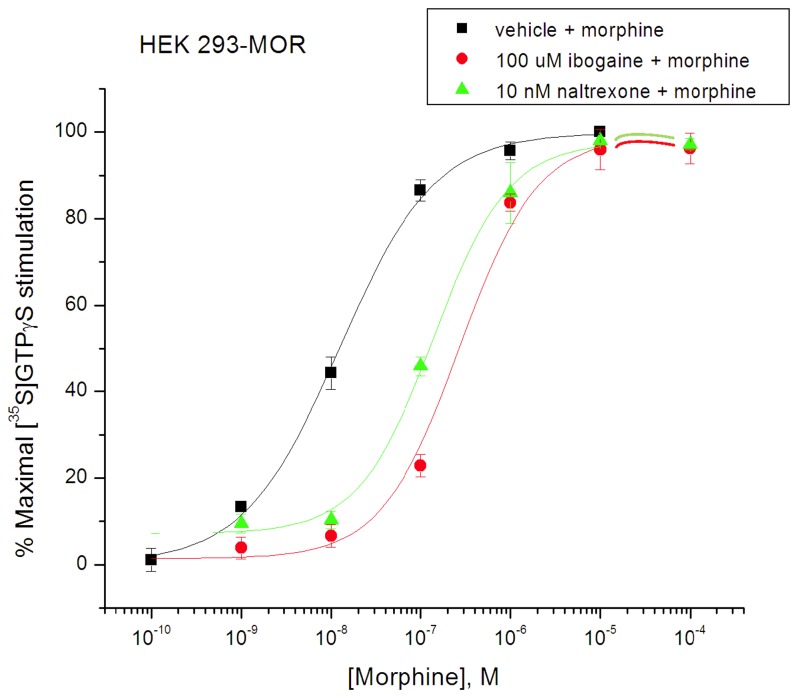
Figure 4. Rightward shift in morphine curves for stimulation of [35S]GTPγS binding in HEK 293-mMOR cells by ibogaine (100 µM) or naltrexone (10 nM) (Reith lab).
The indicated fixed concentration of ibogaine was co-present with increasing concentrations of morphine (colored curves). Otherwise as in Figure 2 .

