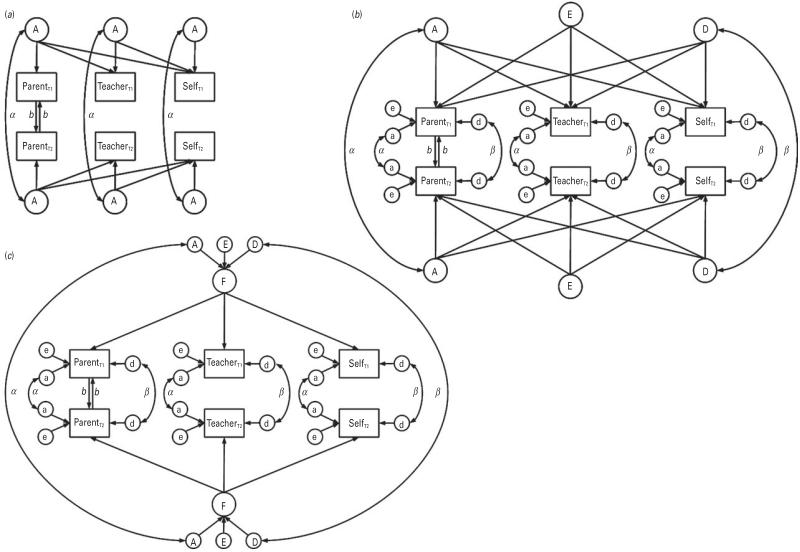
Fig. 1.
Path diagrams for the multivariate genetic models. (a) Correlated factors solution: depicts only the additive genetic (A) correlations between parent, teacher and self-ratings of attention deficit hyperactivity disorder (ADHD), for illustrative purposes; non-additive genetic (D) and non-shared environmental (E) correlations are similar, except that the coefficient of relatedness between twins is β for D and 0 for E. (b) Independent pathway model: A, D and E are common components of variance; a, d and e are residual components of variance unique to each informant. (c) Common pathway model: A, D and E are components of variance influencing the common latent factor (F); a, d and e are residual components of variance unique to each informant. T1, twin 1; T2, twin 2; A, additive genetic component of variance; b, contrast effect for parent ratings; α, coefficient of additive genetic relatedness between T1 and T2, set to 1.00 for monozygotic (MZ) pairs and 0.5 for dizygotic (DZ) pairs; β, coefficient of non-additive genetic relatedness between T1 and T2, set to 1.00 for MZ pairs and 0.25 for DZ pairs.

