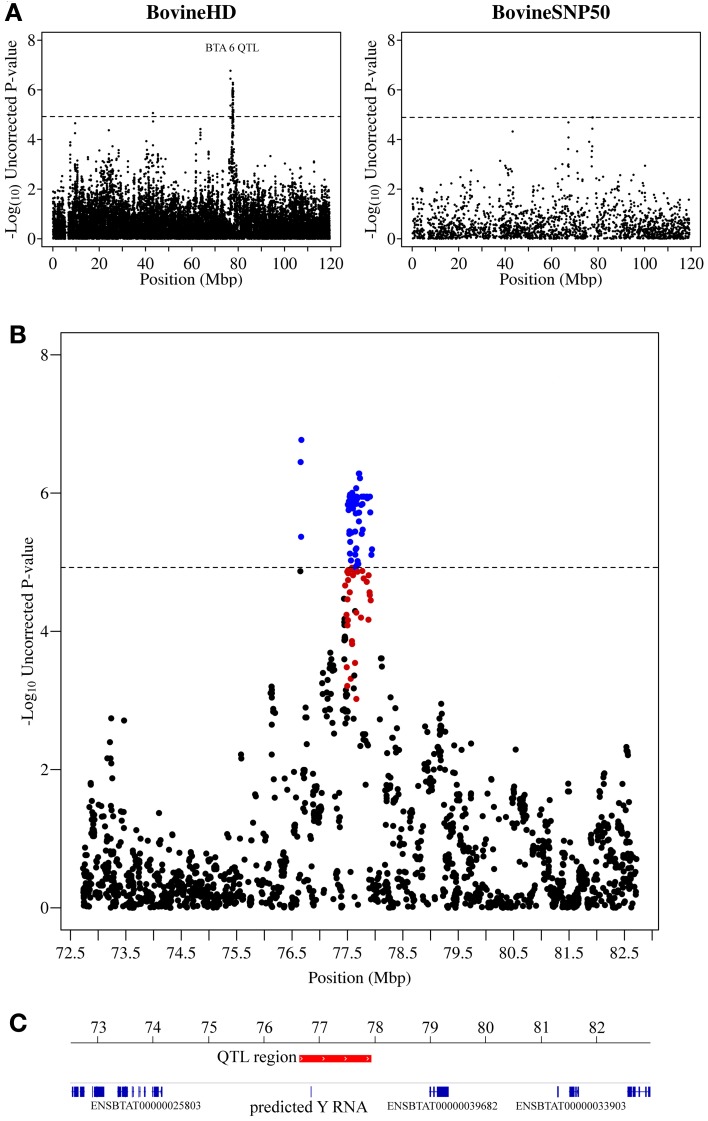
Figure 2.
QTL region associated with SCS on chromosome 6. (A) Compares the associations from this study (Illumina BovineHD BeadChip) with those of a previous study (Meredith et al., 2012) of similar design but using a lower-density genotyping array (Illumina BovineSNP50 BeadChip). (B) Shows the associated region (associations from current study) in closer detail with significant SNPs indicated in blue and any SNP in moderate to strong linkage disequilibrium (r2 ≥ 0.5) with a significant SNP indicated in red. (C) Shows the genes that are annotated in this region based on the UMD 3.1 assembly annotation from Ensembl. The genome-wide significance threshold is indicated by a dashed line.

