
Fig. 2.
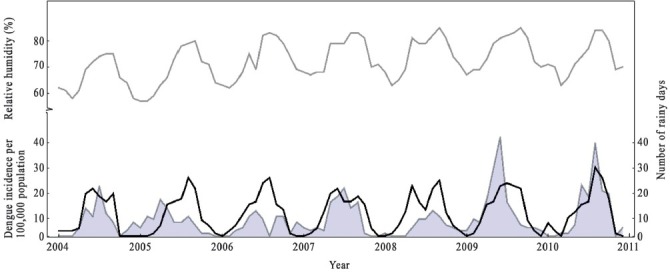
Relative humidity (%) (gray line), the number of rainy days (black line) and dengue incidence per 100,000 population (shaded area) in Sisaket, Thailand from January 2004 to December 2010.
Weather Data Source: Thai Meteorological Department.
Official websites use .gov
A
.gov website belongs to an official
government organization in the United States.
Secure .gov websites use HTTPS
A lock (
) or https:// means you've safely
connected to the .gov website. Share sensitive
information only on official, secure websites.
Relative humidity (%) (gray line), the number of rainy days (black line) and dengue incidence per 100,000 population (shaded area) in Sisaket, Thailand from January 2004 to December 2010.
Weather Data Source: Thai Meteorological Department.