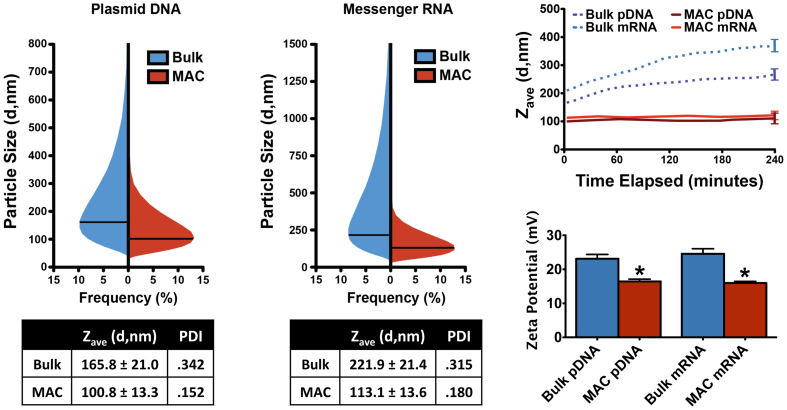
Figure 2. Size and charge characterization of nanocomplexes.
(A) Size frequency distributions by intensity of polyplexes measured by dynamic light scattering immediately following preparation, with Z-average diameters indicated with black lines. Z-average diameter ± SEM and polydispersity indices are reported below for bulk and MAC preparations of both pDNA and mRNA polyplexes (n = 5 each). (B) Aggregation propensity shown as the Z-average diameter over time (n = 5 each, measured at 5 minute intervals) (C) Zeta potential for each type of polyplex, shown as mean ± SEM and analyzed with student's t-test (* p < 0.05) (n = 5 each).

