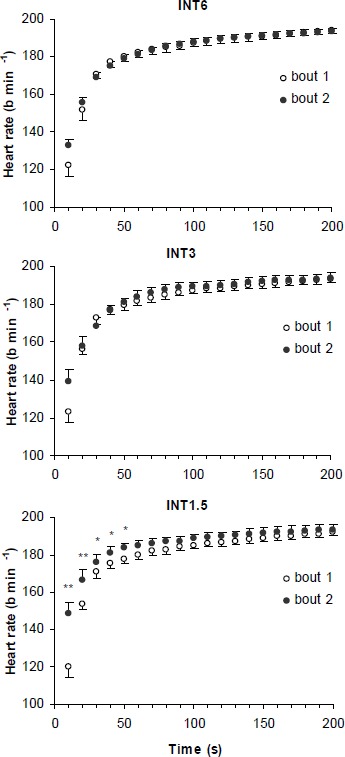
Figure 4.

Heart rate responses during two bouts of maximal rowing exercise with three different recovery intervals (INT1.5, INT3 and INT6). For clarity, data are presented as 10-s averages. * p < 0.05 and ** p < 0.01 compared with corresponding time values of bout 1.
