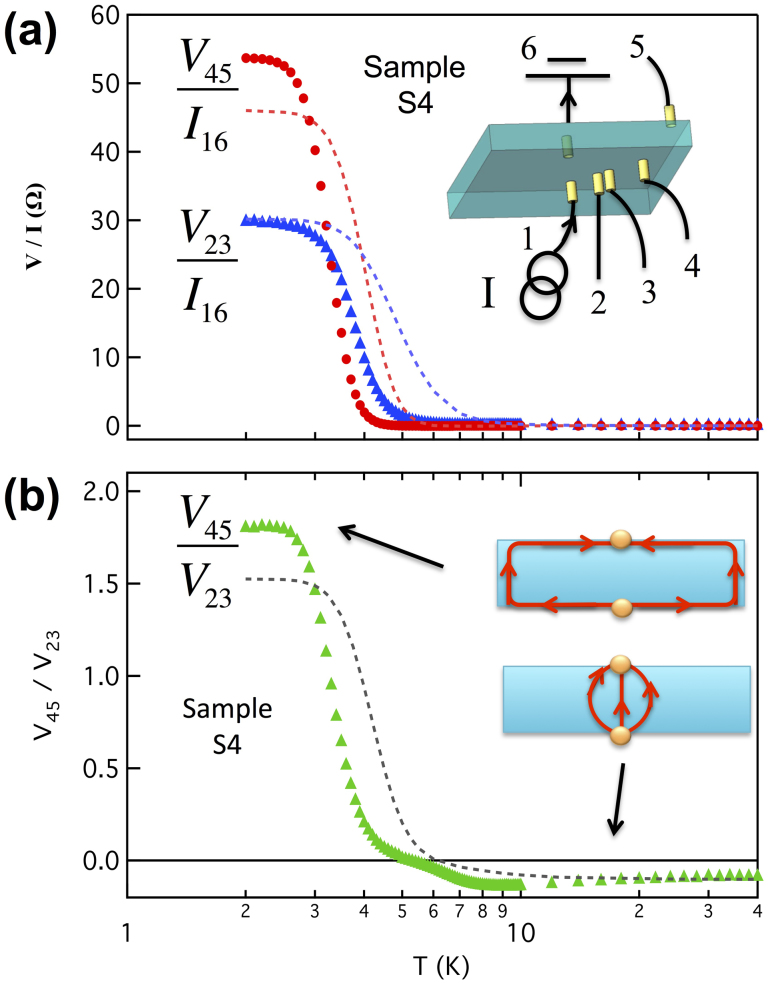
Figure 2. Nonlocal transport due to surface conduction.
(a), Markers, nonlocal resistance V45/I16 and local resistance V23/I16 versus temperature T. Dashed lines are finite element simulations. Inset is a schematic of the measurement configuration on sample S4. (b), Ratio between nonlocal and local voltages V45/V23 versus T. Dashed lines are finite element simulations. Inset, cartoons for current distribution in sample cross-section for surface and bulk dominated conductions.

