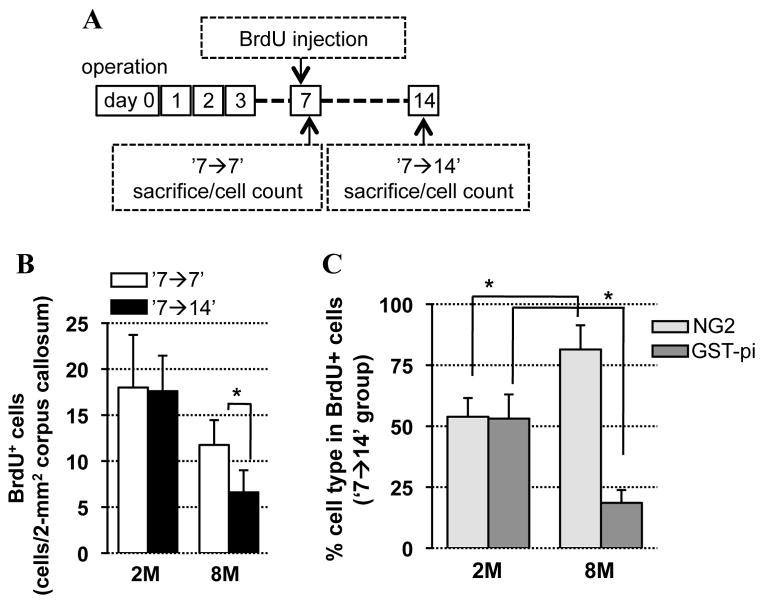
Figure 3. OPC differentiation in vivo.
A. Experimental schedule to assess cell differentiation in the corpus callosum using BrdU. B. Number of BrdU–positive (BrdU+) cells in corpus callosum at days 7 and 14. N=5. 2M: 2-month old mice, 8M: 8-month old mice. C. Ratio of BrdU/NG2- and BrdU/GST-pi-double-labeled cells in total BrdU cells in corpus callosum at day 14 (BrdU injection: day 7). N=5. Values are mean ± SD. *P<0.05.

