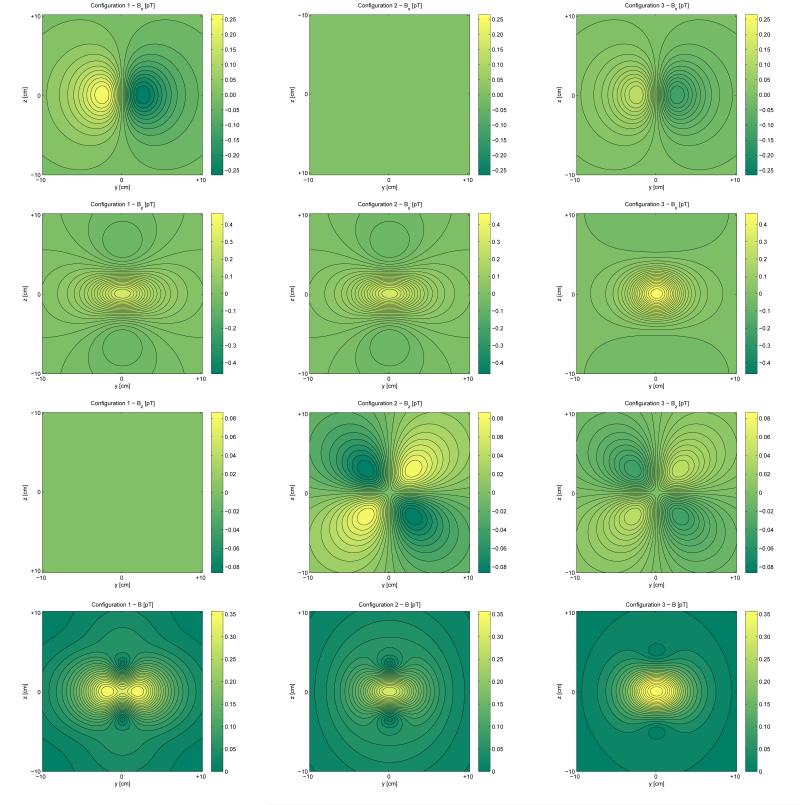
FIG. 4.
(Color online). Two-dimensional plots of the magnetic field components (Bx, By and Bz) and magnitude (|B|) due to the three alterative configurations of the electrically silent quadrupole a21 in FIG. 1. The field components and magnitude for are in the first column (configuration 1 - white arrows in FIG. 1), those for are in the second column (configuration 2 - black arrows in FIG. 1), and those for are in the third column (configuration 3 - gray arrows in FIG. 1). Colormap scaling is symmetric for each plot in the sense that the minimum and maximum in each colormap have the same absolute value. Moreover, the colormap scaling is identical for each field component as well as field magnitude so that differences in amplitude between configurations can be more easily visualized. The origin of the coordinate system is located at (0, 0, 0) cm and the horizontal surface for which data are drawn is located at a height of x = 5 cm above the y − z plane. The unit of dipole strength q is equal to 1 μA · m. For configuration 1, because the resultant dipole vectors from which the multipoles are composed are directed along ẑ, the quantity Bz is identically equal to zero in the horizontal plane, though it is depicted for completeness. An analogous situation occurs in the case of the second configuration. For the third configuration, however, the constitutive dipoles (shown in gray in FIG. 1) are not aligned along any of the coordinate system axes, hence the analogy does not hold in this last case. The abbreviations used are pT (picoTesla = 10−12 T), fT (femtoTesla = 10−15 T) and aT (attoTesla = 10−18 T).

