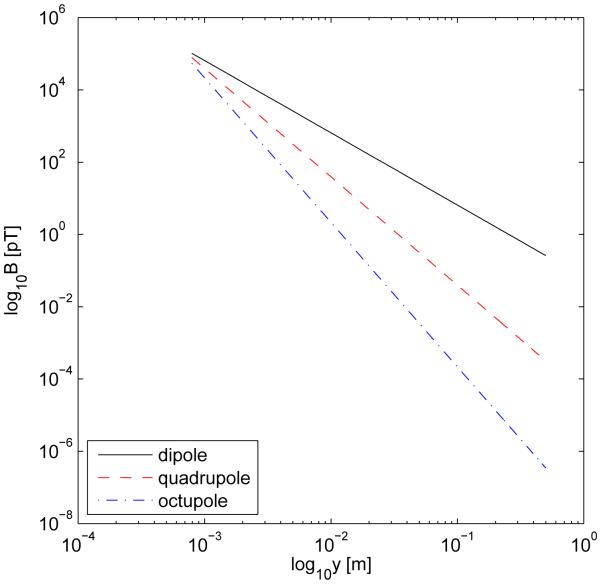
FIG. 7.
(Color online). Log-log plot for the fall-off of the dipolar, quadrupolar and octupolar magnetic fields displayed in FIG. 6 as a function of distance. The data shown are for a line segment along the x axis in the distance range 5 ≤ x ≤ 500 cm.

