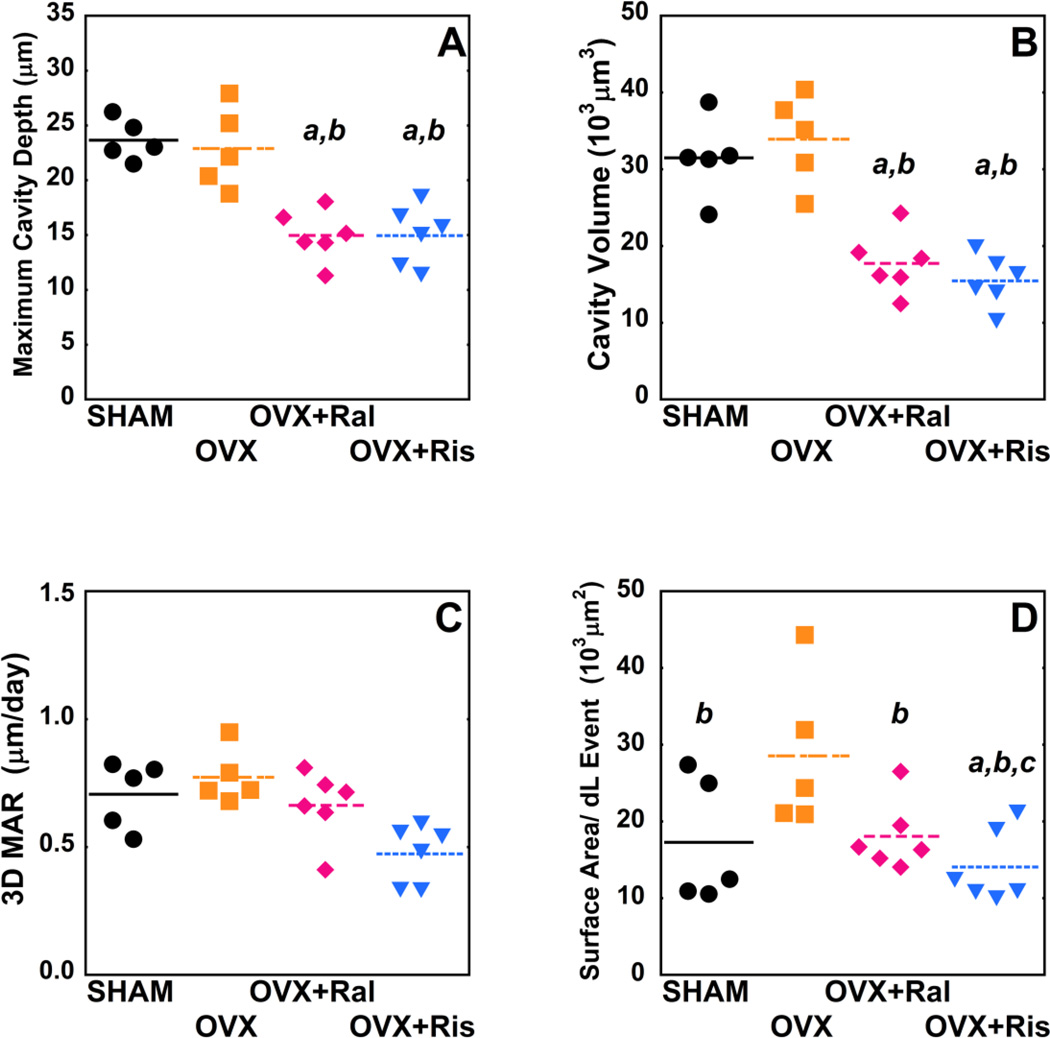
Figure 5.
Median measurements of individual resorption cavities and formation events are shown for each of the study groups (p<0.05), (A) Cv.De, (B) Cv.V, (C), 3D MAR (D) MS/dL.Ev. Statistical differences are shown based on generalized least sequres regression models that include all events and donor as a random effect. a- p < 0.05 vs. SHAM operated, b- p < 0.05 vs. OVX untreated, and c- p < 0.05 vs. OVX+Ral.

