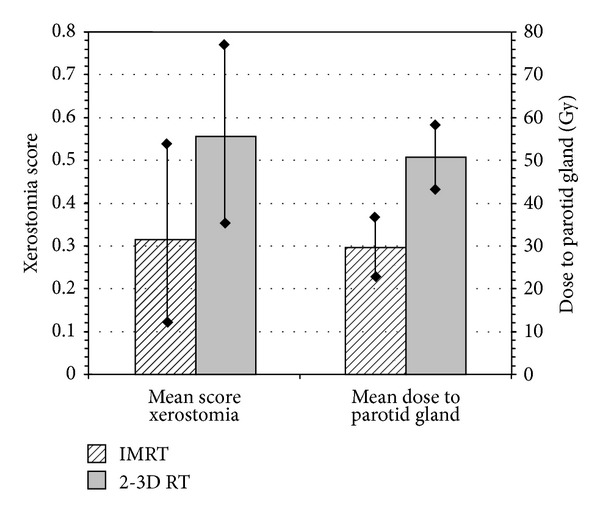
Figure 2.

Comparative descriptive analysis of mean dose to parotids and mean xerostomia score stratified by RT technique. A significant difference was noted between the IMRT and conventional technique for both doses to parotids (P = 0.016) and xerostomia (P < 0.001). The related scale referring to the y-axis either right or left is presenting the dose to the parotids and the xerostomia score, respectively. Data were available from twenty published trials.
